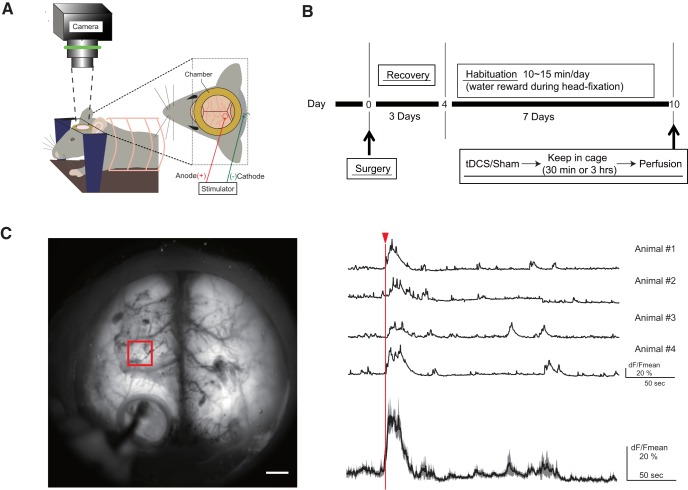
Figure 1.
Head-restraint tDCS experiment. A, Experimental setup for tDCS. B, Experimental schedule of immunohistochemical experiment. C, Top view of a BAC-GLT1-G7 Line 817 (G7NG817) mouse. Fluorescent Ca2+ signal is transcranially observable. Signals ∼3 mm anterior to the anodal site (1 × 1 mm2 red square) are plotted from four mice (right, top traces). The bold trace on the bottom is the mean of the four traces, and the shaded areas represent SE. The red arrowhead and line indicate the onset of tDCS. Scale bar, 1 mm. tDCS-induced Ca2+ elevations were not observed in isoflurane-anesthetized mice (Extended Data Fig. 1-1).

