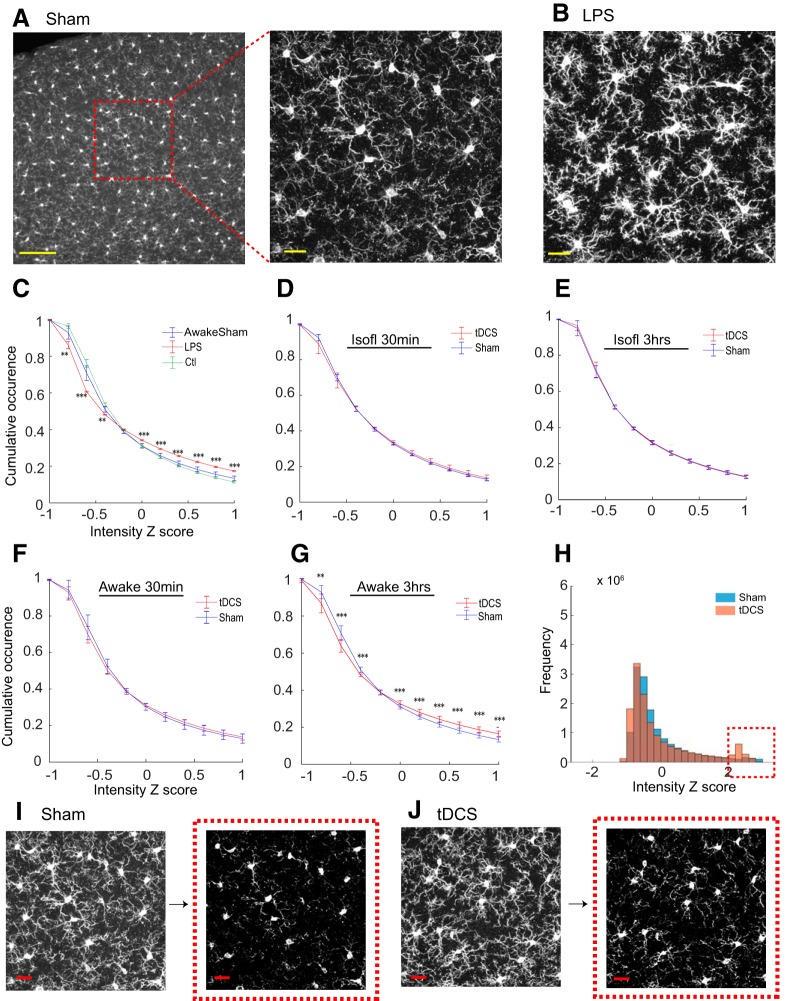
Figure 2.
Intensity analysis of microglial confocal images. A, B, Representative images of Cy3-labeled Iba1 IHC by maximum intensity projection obtained in Sham- and LPS-treated mice. Yellow scale bars: A, left, 100 μm; A, right, B, 20 μm. C, Cumulative pixel intensity distributions from unrestrained Ctl and head-restrained Sham groups were similar and distinct from the LPS-treated group. D–G, Intensity was compared between tDCS- and Sham-treated groups under the isoflurane-anesthetized (D, E) or awake (F, G) conditions, perfused at 30 min or 3 h after sham/tDCS. H, In awake mice, the pixel intensity histogram indicates that there is a cluster at z score >2 (i.e., mean + 2 SDs) region in the tDCS group (dotted red square). I, J, Representative images from a sham-treated mouse and a tDCS-treated mouse. Images in the red squares correspond to the thresholded images on the left at the mean + 2 SDs. Red scale bars, 20 μm. **p < 0.01, ***p < 0.001.

