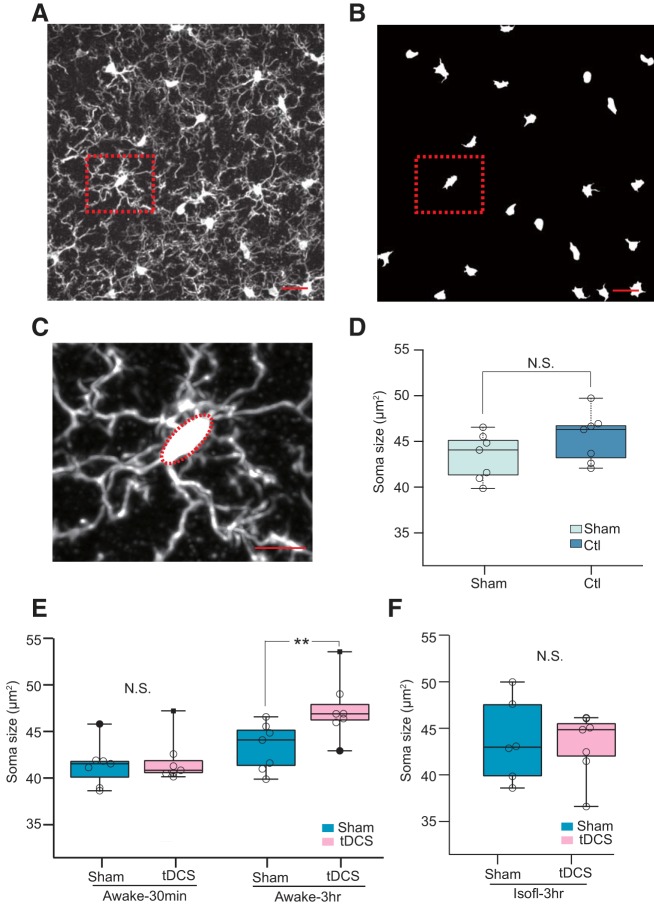
Figure 3.
Quantification and comparison of microglial soma size. A, Example image of an Iba1 IHC confocal image stack collapsed by maximum intensity projection. Scale bar, 20 μm. B, Digitally processed image of A for soma extraction. C, Example of the elliptic approximation of soma (A, B, red dotted square). D, Comparison of median values of microglial soma areas between Sham-stimulated and unrestrained control mice (p = 0.1a, Mann–Whitney Wilcoxon rank sum test). Scale bars: A, B, 10 μm; C, 20 μm. E, Comparison of microglial soma size in awake mice with/without tDCS treatment at different time points (30 min or 3 h) after tDCS. Microglial soma size was larger in the tDCS group in the awake 3 h experiment (p = 0.017c, Mann–Whitney Wilcoxon rank sum test). Each group contains seven mice. F, Microglial soma size comparison in isoflurane-anesthetized mice (Isofl-3hr). **p < 0.03, N.S. not significant.

