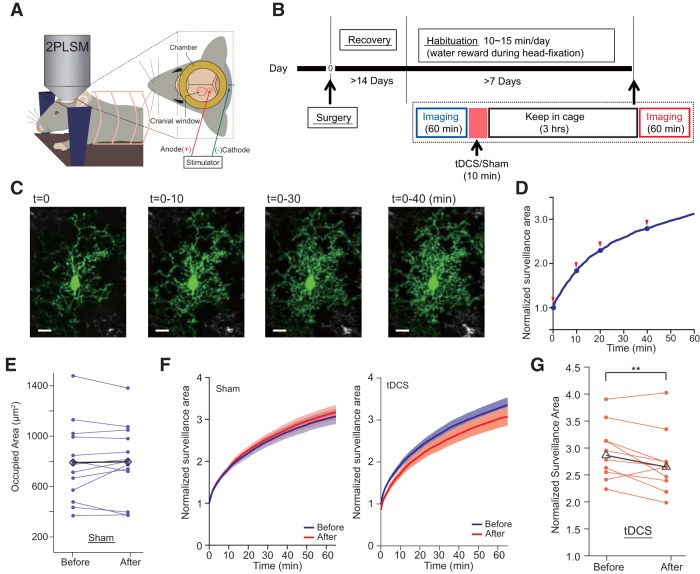
Figure 6.
In vivo monitoring of microglial morphologic dynamics. A, B, Experimental setup (A) and time schedule of in vivo two-photon imaging (B). C, Representative images of a microglia overlaid from t = 0 to respective time points (10, 30, and 40 min). D, Normalized surveillance area curve during 60 min imaging period. Red arrowheads show the time points for the images in C. Scale bar, 10 μm. E, Initial microglial area at t = 0 of Before and After sessions are similar in Sham mice (13 cells from 8 mice; p = 0.82i). Blue lines represent data from individual microglia, and the black line represents averaged data. F, Normalized surveillance area curves during the 60 min imaging period before (blue) and after (red) stimulation in the sham (left) and tDCS (right) mice. Data are represented as the mean ± SEM. G, Normalized surveillance area at t = 40 min in Before and After sessions in tDCS-treated mice (normalized by surveillance area at t = 0/Before). Red lines represent data from individual microglia, and the black line represents averaged data. p = 0.014j, paired t test. **p < 0.03.

