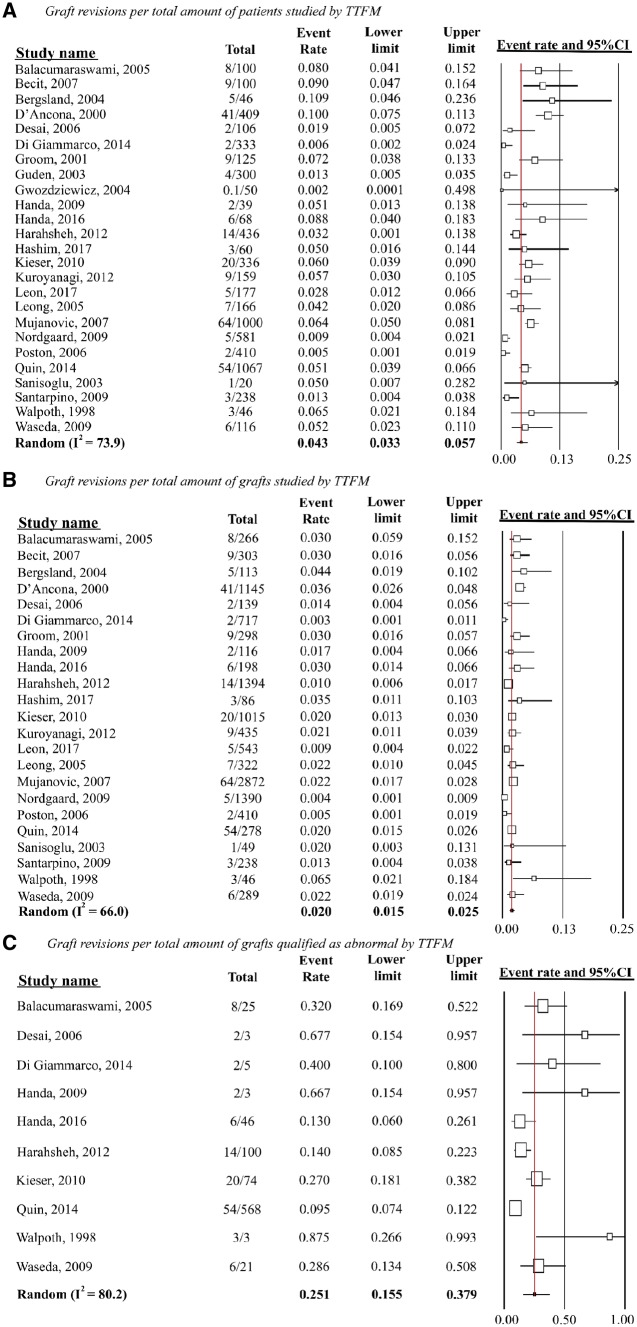
Figure 2:
Random-effects models on pooled TTFM study outcomes. (A) Graft revision per total amount of patients studied by TTFM, (B) graft revisions per total amount of grafts studied by TTFM and (C) graft revisions per total amount of grafts qualified as abnormal by TTFM. I2 indicates heterogeneity (range 0–100; 0 being entirely homogenous). CI: confidence intervals; TTFM: transit-time flow measurement.

