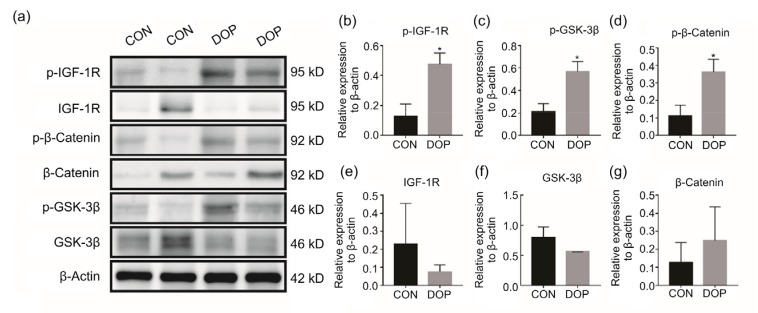
Fig. 3.
Enhanced phosphorylation levels of the IGF-1R/β-catenin signaling axis
(a) The representative brands were presented, indicating the enhancement of phosphorylation levels of IGF-1R/β-catenin signaling. Quantitative analysis showed increased p-IGF-1R (b), p-GSK-3β (c), and p-β-catenin (d), but unchanged total IGF-1R (e), GSK-3β (f), and β-catenin (g). IGF-1R: insulin-like growth factor-1 receptor; GSK-3β: glycogen synthase kinase-3β; CON: control; DOP: diabetic osteoporosis. All data are expressed as mean±SD (n=3). * P<0.05, vs. CON

