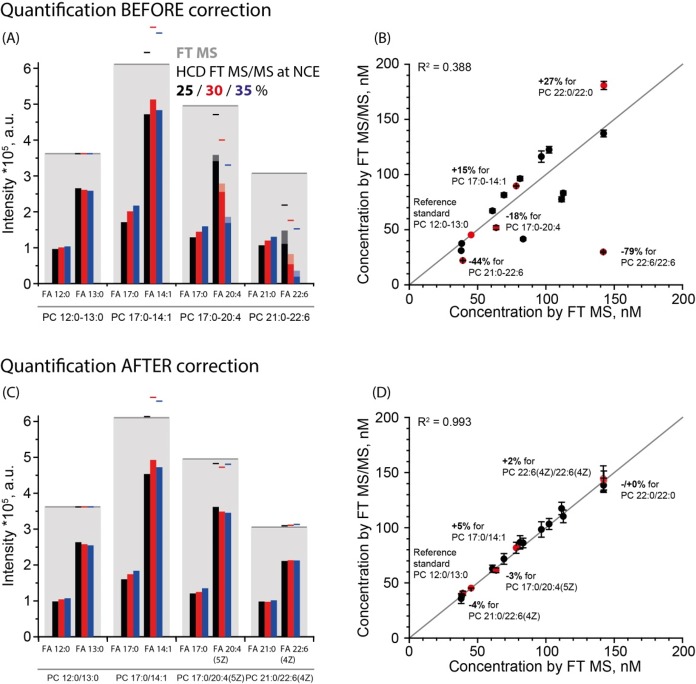
Figure 3.
Adjustment of abundances of CA fragments improved the concordance between top-down and bottom-up quantification. (A) Uncorrected intensities of CA fragments at different NCE (inset) in MS/MS spectra of four PC species (indicated below the bars). Lines above the bars indicate the sum of intensities of sn-1 and sn-2 fragments; shaded parts of the bars stand for intensities added by accounting for the products of CO2 loss. Gray shaded bars indicate the intensities of intact precursor peaks in the FT MS spectrum. (B) Correlation plot of lipid standards quantified by FT MS and by HCD FT MS/MS. (C) The intensities of the same CA peaks after LipidXte correction. (D) Correlation plot after LipidXte correction.

