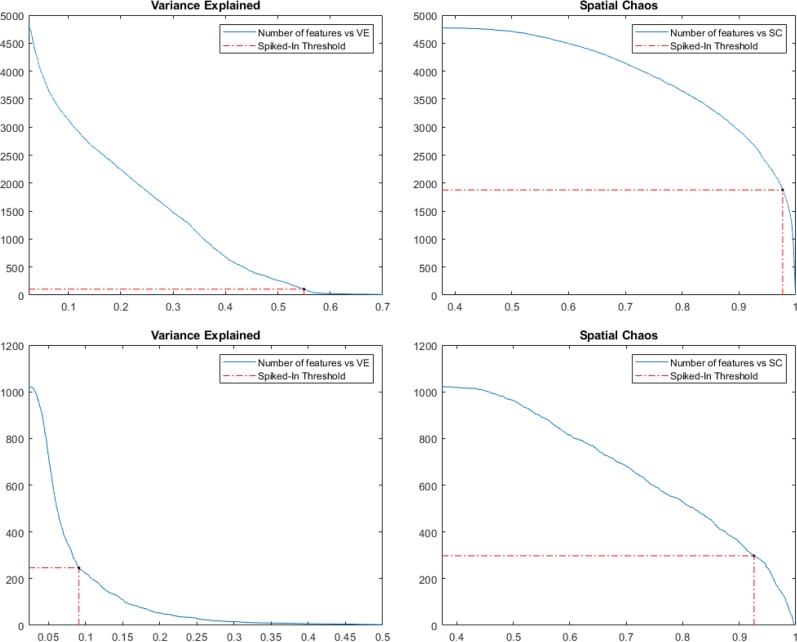
Figure 4.
Number of ion images surviving varying thresholds on the VE and SC scores in the two data sets. Dashed lines mark the lowest scores (excluding the low quality image for m/z 616.127) of the ion images corresponding to the drugs in the spiked data set (top) and known compounds in the mouse bladder data set (bottom).

