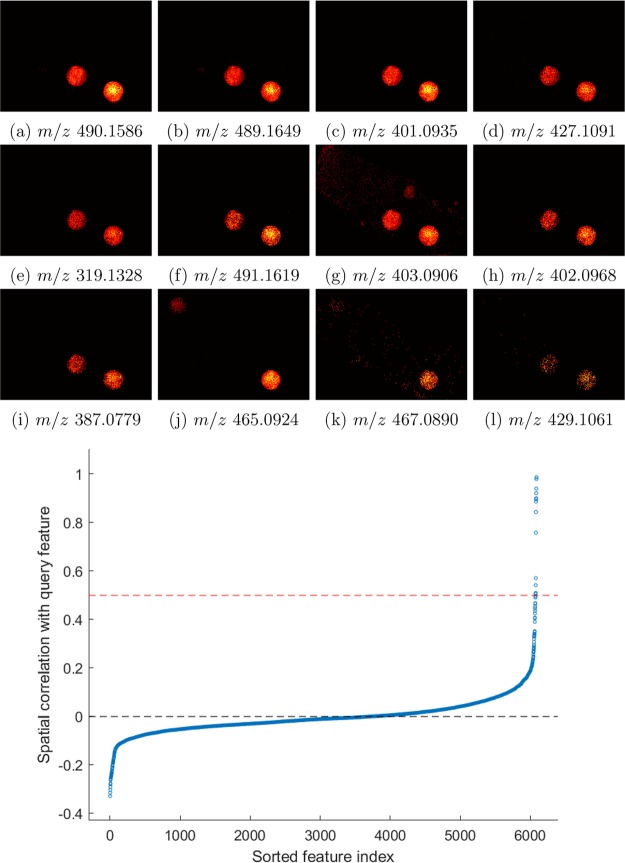
Figure 5.
Top: The ion images of the 12 most correlated peaks to dasatinib’s monoisotopic peak. Panels a–i and l are isotopes or fragments of dasatinib while panels j and k are related to sorafenib. Bottom: Sorted Pearson correlation between all ion images and that of the monoisotopic peak of dasatinib.

