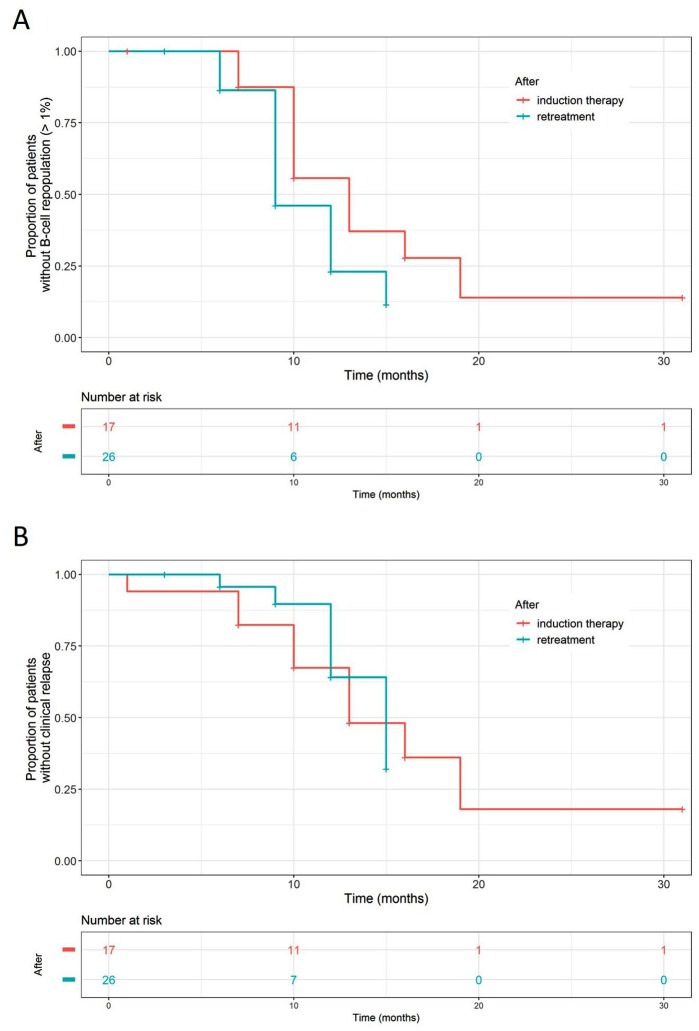
Figure 3.
Kaplan–Meier curves for circulating CD19+ B-cell repopulation (a, log-rank test, p = 0.093) and clinical relapse (b, log-rank test, p = 0.76) following an induction treatment with low-dose rituximab (375 mg/m2 twice with a 2-week interval, depicted in red) and retreatment (375 mg/m2 once, in green). The outcome of clinical relapse and B-cell repopulation would be confounded by retreatment decision which was based on either event. To mitigate this confounding effect, when we analyzed the effect of rituximab on B-cell repopulation, the event of clinical relapse was treated as censoring. The same approach for the effect on clinical relapse with the event of B-cell repopulation being treated as censoring.

