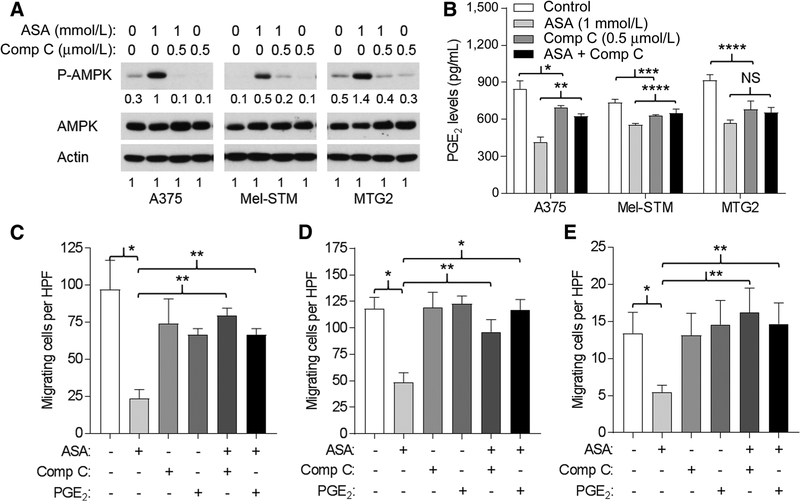
Figure 3.
ASA-mediated inhibition of migration reversed by Comp C and PGE2. A, Western blots of cells after treatment with ASA and/or Comp C for 24 hours. Representative blot from two experiments. Numbers are from densitometry scan. B, PGE2 concentrations of supernatants from cells incubated 24 hours with ASA, Comp C, or both (Comp C added 1 hour before ASA) as indicated. For ANOVA, P < 0.001 for each cell type. For t test comparisons: *, P = 0.08; **, P = 0.009; ***, P = 0.02; ***, P = 0.05. NS, not significant. C, Migration (24 hours) of A375 cells per high-power field (HPF) in the absence or presence 1 mmol/L ASA, 0.5 μmol/L Comp C, and 1 μmol/L PGE2 as indicated. Comp C or PGE2 was added 1 hour before ASA. For ANOVA, P < 0.001. For t test comparisons: *, P = 0.004; **, P < 0.001. D, Migration of Mel-STM cells as in C. For ANOVA, P = 0.003. For t test comparisons: *, P = 0.008; **, P = 0.03. E, Migration of MTG2 cells as in C. For ANOVA, P = 0.005. For t test comparisons: *, P = 0.05; **, P = 0.04.

