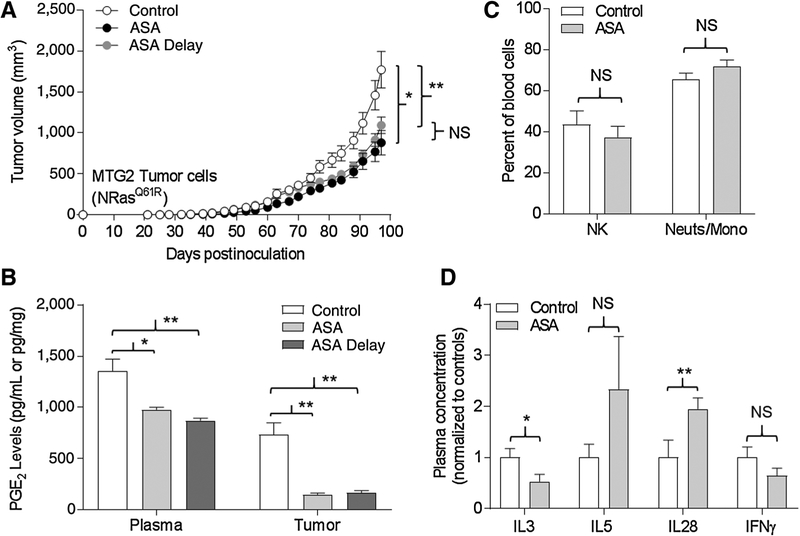
Figure 8.
ASA inhibits growth and suppresses PGE2 in established tumors. Oral daily gavage with 100 μL water (control) or ASA (0.4 mg) began one week prior to implantation of tumor cells, or with ASA (ASA delay) once tumors reached a diameter of 5 mm (n = 9–10 mice/group), and continued daily until termination. A, Tumor growth. *, P = 0.004; **, P = 0.01; NS, not significant. B, PGE2 levels in plasma (pg/mL) and tumors (pg/mg) at termination. *, P 0.005; **, P < 0.001. C, Immune cell profiling of NK (DX5+CD3−) cells and neutrophils/monocyte (CD11b+GR1−) cells in blood at termination. D, Plasma cytokines at termination. Levels were normalized to the control group for each. *, P = 0.03; **, P = 0.04.

