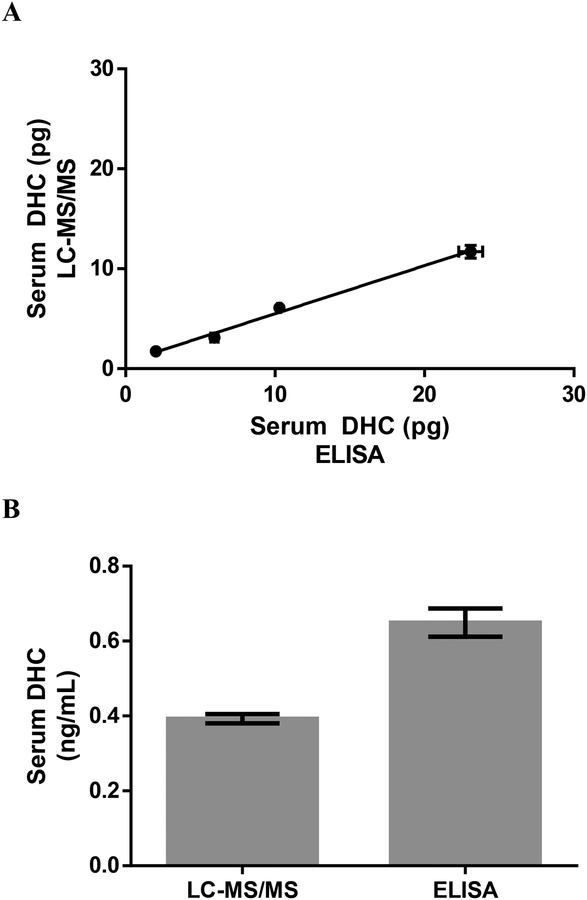
Figure 3:
Picograms of 11-dehydrocorticosterone (DHC) in serial diluted mouse serum measured by LC-MS/MS and ELISA (n=2/method/dilution) (A) and concentraton of DHC in the same mouse serum measured by LC-MS/MS and ELISA (n=8/method) (B). DHC concentration for each method was determeined by first calculating the average conentration of each volume of serum volume and then calculating the average of all serum DHC concentrations. Data are expressed as mean ± SEM.

