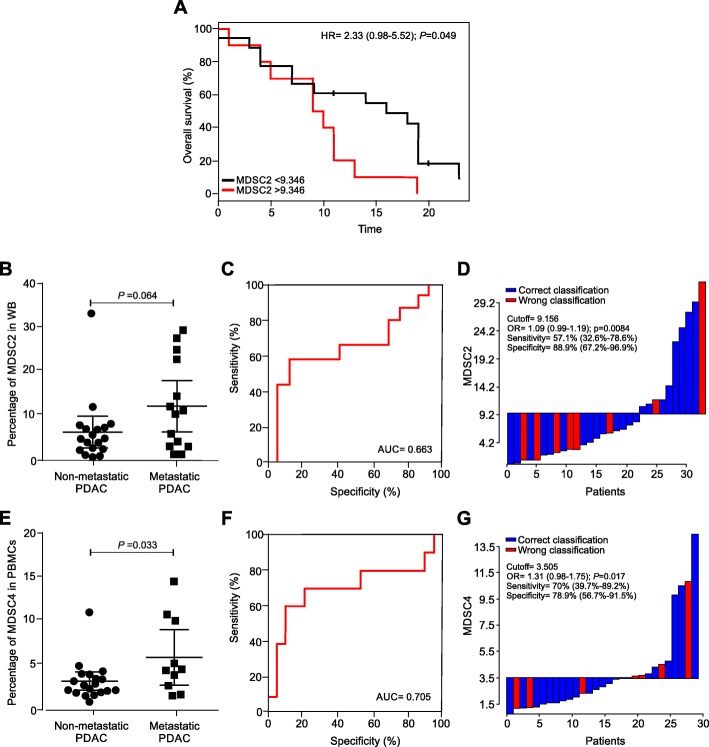
Fig. 3.
Prognostic potential predictive role of MDSCs in PDAC patients. a Kaplan–Meier curves for OS by significant MDSC2 cutoff frequency in fresh whole blood samples. b MDSC2 percentages in non-metastatic and metastatic PDAC patients. Mean and 95% confidence interval are plotted. Statistical analysis was performed by ANOVA test. c Receiver operator characteristic (ROC) curve for MDSC2 percentage in metastatic disease prediction. d Waterfall plot of optimal dichotomization; blue and red bars represent cases with correct or wrong classification, respectively. e MDSC4 percentage in non-recurrent and recurrent PDAC patients. Mean and 95% confidence interval are plotted. Statistical analysis was performed by ANOVA test. f Receiver operator characteristic (ROC) curve for MDSC4 percentage in metastatic disease prediction. g Waterfall plot of optimal dichotomization, blue and red bars represent cases with correct or wrong classification, respectively

