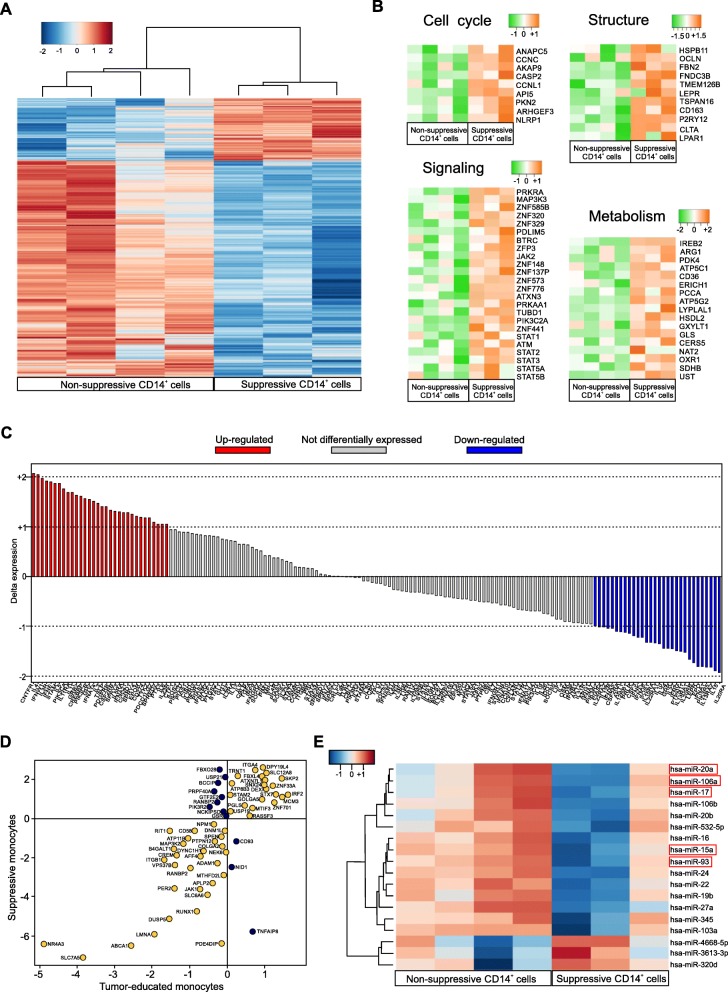
Fig. 5.
Gene profiling of suppressive CD14+ cells isolated from PDAC patient. a Supervised clustering of suppressive and not suppressive monocytes arrays using 1119 differentially expressed genes (FDR < 0.05 and absolute fold change > 2). b Clustering of cell cycle, structure, signaling and metabolism in suppressive- and not suppressive monocytes (absolute fold change > 2; FDR < 20%). c Difference in expression between suppressive monocytes isolated from PDAC patients and human BM-MDSCs samples for genes in JAK/STAT Signaling Pathway. d Dot plot of log fold change demonstrating common (yellow plots) or different (purple plots) gene expression modulation between differentially expressed signature of either tumor-educated or suppressive monocytes to related controls. e miRNAs-expression profile of suppressive and non-suppressive CD14+ cells isolated from PDAC patients using 19 differentially expressed miRNAs (FDR < 0.05 and absolute fold change > 2)

