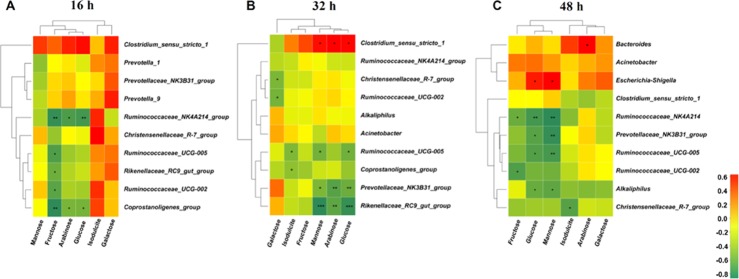
Figure 6.
Spearman correlation analysis between top 10 bacterial genera and monosaccharide concentrations after fermentation for (A) 16, (B) 32, and (C) 48 h. Asterisks indicate significant correlations between bacteria and monosaccharide. Cells are colored based upon the Spearman correlation coefficient between the significantly altered genera and monosaccharide; the red represents a significantly positive correlation (P < 0.05), the green represents a significantly negative correlation (P < 0.05), and the yellow represents no significant correlation (P > 0.05). n = 3 per group. SDF 0% means SDF/IDF = 0:1; SDF 25% means SDF/IDF = 1:3; SDF 50% means SDF/IDF = 1:1; SDF 75% means SDF/IDF = 3:1; and SDF 100% means SDF/IDF = 1:0.

