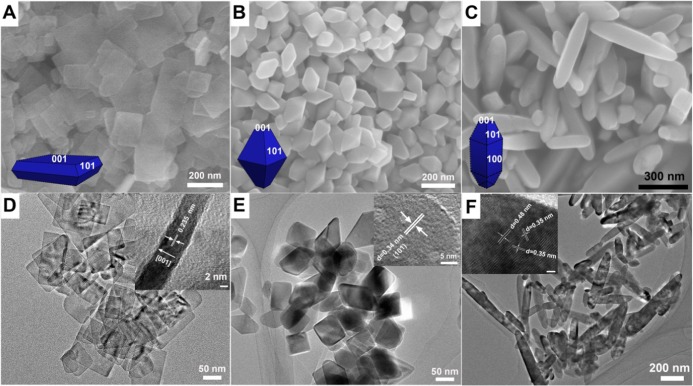
Figure 2.
SEM images of (A) R-TiO2-001, (B) R-TiO2-101, and (C) R-TiO2-100. TEM images of (D) R-TiO2-001, (E) R-TiO2-101, and (C) R-TiO2-100; insert figures of figure (A), (B), and (C) is the corresponding equilibrium crystal shape with predominated {001}, {101}, and {100} facets. Insert figures of figure (D), (E), and (F) is their corresponding HRTEM images.

