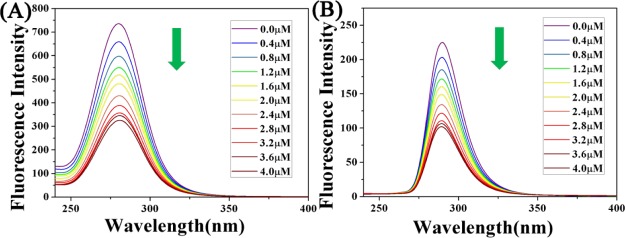
Figure 3.
(A) Synchronous fluorescence spectrum of the reaction of BSA (10 μM, 50 mM Tris-HCl, 50 mM NaCl, pH = 7.2) with complex 1 (0–4.0 μM) when Δλ = 60 nm, and (B) synchronous fluorescence spectrum of the reaction of BSA (10 μM, 50 mM Tris-HCl, 50 mM NaCl, pH = 7.2) with complex 1 (0–4.0 μM) at Δλ = 15 nm. Arrows indicate the changes in wavelength as the compound increases.

