
Figure 8.
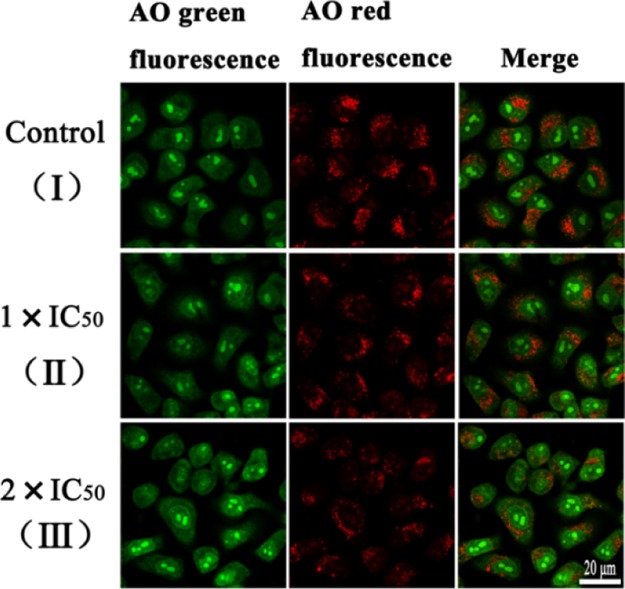
LMP in A549 cancer cells. (I) A549 cells without added complex 1. A549 cells were incubated with complex 1 of 1 × IC50 (II) and 2 × IC50 (III) for 6 h and then stained with AO (5 μM, 15 min) at 310 K. The cells were measured using a two-photon laser scanning microscope (AO green fluorescence, λex = 488 nm and λem = 510 ± 20 nm; AO red fluorescence, λex = 488 nm and λem = 625 ± 20 nm). Scale bar: 20 μm.