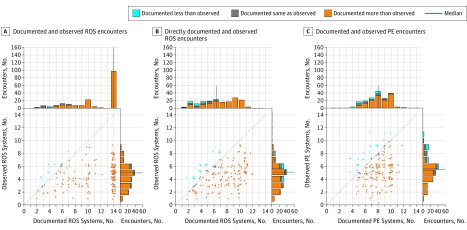
Figure 2. Scatterplot of the Number of Systems Documented vs the Number Observed.
A, The assumption was that attestation of all review of systems (ROS) are negative denoted documentation of 14 systems. B, The attestation of all ROS are negative is ignored, so systems directly documented are displayed. C, Scatterplot depicting verifiable physical examination (PE) documentation and observation. A-C, Each dot represents 1 patient-physician encounter; orange dots indicate that the number of systems documented exceeded the number observed, blue dots when the opposite occurred, and gray dots when the number of systems matched. The dotted line represents ideal physician documentation behavior, ie, when documentation matches what transpired. The histograms show the distribution of the number of systems documented and discussed, again with orange and blue depicting overdocumentation and underdocumentation and gray representing neither. The navy blue line represents the median number of systems on each histogram. Random jitter has been applied to scatterplot points to reduce superimposition of dots.

