

Abstract
Mo nitrogenase (N2ase) utilizes a two-component protein system, the catalytic MoFe and its electron-transfer partner FeP, to reduce atmospheric dinitrogen (N2) to ammonia (NH3). The FeMo cofactor contained in the MoFe protein serves as the catalytic center for this reaction and has long inspired model chemistry oriented toward activating N2. This field of chemistry has relied heavily on the detailed characterization of how Mo N2ase accomplishes this feat. Understanding the reaction mechanism of Mo N2ase itself has presented one of the most challenging problems in bioinorganic chemistry because of the ephemeral nature of its catalytic intermediates, which are difficult, if not impossible, to singly isolate. This is further exacerbated by the near necessity of FeP to reduce native MoFe, rendering most traditional means of selective reduction inept. We have now investigated the first fundamental intermediate of the MoFe catalytic cycle, E1, as prepared both by low-flux turnover and radiolytic cryoreduction, using a combination of Mo Kα high-energy-resolution fluorescence detection and Fe K-edge partial-fluorescence-yield X-ray absorption spectroscopy techniques. The results demonstrate that the formation of this state is the result of an Fe-centered reduction and that Mo remains redox-innocent. Furthermore, using Fe X-ray absorption and 57Fe Mössbauer spectroscopies, we correlate a previously reported unique species formed under cryoreducing conditions to the natively formed E1 state through annealing, demonstrating the viability of cryoreduction in studying the catalytic intermediates of MoFe.
Short abstract
The first critical intermediate of the nitrogenase catalytic cycle, E1, requires the accumulation of one electron and one proton at the FeMo cofactor. Using Fe and Mo X-ray absorption and 57Fe Mössbauer spectroscopies, we compare native E1 with a cryoreduction/annealing protocol to deconvolute these steps. We find that Fe-centered reduction occurs regardless of the reduction method, while MoIII remains redox-innocent. Furthermore, E1 can be generated by annealing cryoreduced E0 at 200 K, which allows for proton mobility.
1. Introduction
The conversion of dinitrogen (N2) to bioavailable ammonia (NH3) is a fundamental step in the biogeochemical nitrogen cycle.1 In nature this process is predominately carried out by nitrogenase (N2ase) enzymes, which have provided the majority of fixed nitrogen for living organisms over the past 2 billion years.2−4 Perhaps the most efficient and well-studied of these systems is the Mo-dependent enzyme “MoFe”, which contains the FeMo cofactor (7Fe-9S-1Mo-1C, commonly referred to as FeMoco; Scheme 1) and the eight Fe containing P-cluster. MoFe functions along with a [4Fe-4S] cluster-containing iron protein (FeP), which serves as the native reductant of MoFe.
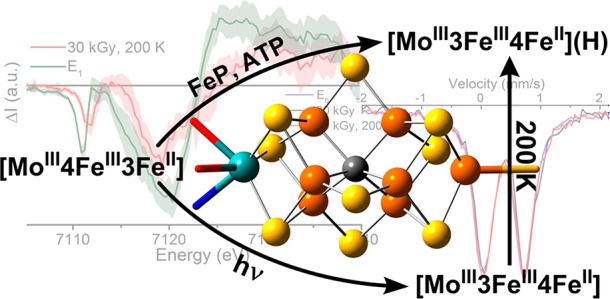
Scheme 1. Current Proposed Relationship between the Previously Observed Natively Reduced (MR) and Cryoreduced (MI) Species Formed at the FeMoco Cluster.
Elements are colored as follows: Mo, cyan; Fe, orange; S, yellow; N, blue; O, red; C, gray.
Mo N2ase and the FeMoco cluster have long inspired model chemistry for the activation of N2 and other small molecules. Shortly following the discovery of Mo as an essential component of Mo N2ase,5 a field of chemistry focused around the tuning of single and polynuclear Mo complexes to bind and reduce N2 ensued.6−14 This route has been somewhat successful and has provided some of the first catalytic N2-activating model complexes.6,9,11,12,15−22 However, in recent years, the focus has turned to Fe because numerous spectroscopic (as well as crystallographic) studies show that substrate binding occurs at a four-Fe face (Fe2,3,6,7) of FeMoco and not at Mo.23−28 Nevertheless, whether or not Mo plays any role in redox chemistry under native reducing conditions has yet to be established, as does the potential role of Mo during the N2 reduction stages.
During the catalytic cycle, stepwise electron transfer is coupled to the transfer of a proton to create intermediates denoted as En(nH), where n is the number of electron-transfer steps (Scheme 2). The ratios of these intermediates to one another are dependent on the rate of electron transfer versus dihydrogen (H2) production from the states E2–E4 and can be influenced by adjusting the ratio of MoFe/FeP during turnover. H2 can be produced at any point in which at least two electrons and protons have accumulated.29−32 In the absence of N2, the cycle is limited to the population of intermediates E0–E4.
Scheme 2. Simplified Depiction of the Kinetic Mechanism of Mo-Dependent N2ase Describing the Relationships between the Catalytic Intermediates En, in Which n Represents the Number of Electrons/Protons Delivered to FeMoco from FeP,29−32.
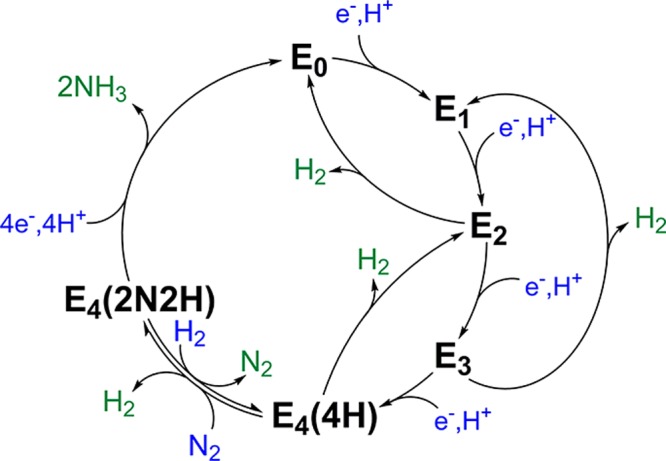
The number of added protons and N atoms is indicated for n = 4.
The presence of this distribution of intermediate states during catalytic turnover has made the trapping of individual intermediate species particularly difficult. This problem has been partly overcome by the use of electron paramagnetic resonance (EPR) and electron nuclear double resonance/electron spin-echo envelope modulation (ENDOR/ESEEM) methods to study these intermediates, which have established that N2 reduction to 2NH3 requires 8 equiv of H+ and e–, along with 16 ATP, as proposed earlier,3,33−36 to bind N2 and cleave the triple bond of nitrogen at FeMoco to produce two molecules of NH3 (eq 1).4,37,38
| 1 |
As indicated in Scheme 2, during its catalytic cycle, N2ase is activated to reduce the N≡N triple bond by the accumulation of n = 4 e–/H+, followed by the reductive elimination of H2 coupled to N2 binding/reduction.
The EPR and ENDOR/ESEEM methods used to achieve these results are limited to odd-electron En intermediates. The resting state of FeMoco is odd-electron, meaning that these methods were restricted to n-even states, leaving the n-odd states unexamined. Beyond the need for ways to address these states, methods that are capable of selective reduction of the FeMoco cluster would be highly valuable for studying all intermediates. This has been no easy task, and while progress has been made in reducing MoFe in the absence of FeP,39−43 there is still no precedence for chemical or electrochemical means of single-electron reduction. To this end, cryoreduction has already offered a promising route to accessing n-even states in the accumulation phase of Mo N2ase (E0–E4).44,45 Cryoreduction involves the direct injection of a radiolytically produced mobile electron into a metal center or cluster at 77 K. Previously, this technique was successfully used to decouple electron- and proton-transfer steps when moving between the E0 and E2 states of FeMoco.45 This technique has also been previously applied in the 57Fe Mössbauer spectroscopy investigation of several oxidation states of Mo N2ase, where it was proposed that native turnover resulted in a Mo-centered reduction, while cryoreduction produced an alternative Fe-reduced state.46
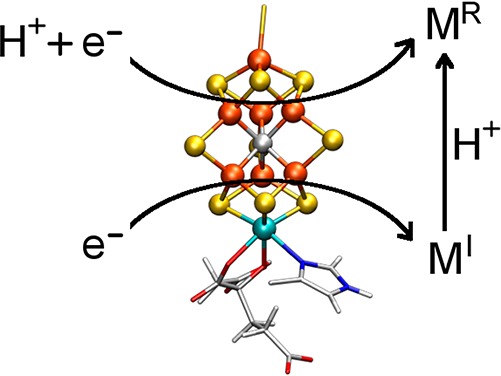
It is well-known from the pioneering work of Lowe and Thorneley that both electron and proton transfer to the FeMoco cluster occur during native turnover.29−32 This provides the opportunity for protonation of either a sulfur or iron in the FeMoco cluster. While spectroscopic characterization of the E1 and E3 states has remained minimal due to their non-Kramers spin states, intensive ENDOR studies support the formation of Fe-hydride species in the E2 and E4 states.38,47,48 From logical deduction, it is also possible that the E1 state involves the formation of a metal-hydride species, making this an alternative to the protonation of a cluster sulfide (Scheme 3). Metal-hydride species are generally highly covalent, making it possible for the average electron density at iron in a metal-hydride containing E1 state to appear very similar or even more oxidized than that of E0. Similarly, protonation of an inorganic sulfide in the cluster may also skew the electron density at Fe despite being formally reduced. In this sense, protonation of either Fe or S may serve to maintain a similar reduction potential for each En state, allowing the catalytic cycle to advance.4 Given these considerations, it may be that the discrepancies between the originally reported46 native turnover and cryoreduced species arise not from a change in the locale of reduction but because the cryoreduced state has not acquired a proton, and that follow-up protonation of FeMoco generates the E1 state (as illustrated in Scheme 1).
Scheme 3. Proposed States and Relationships between the E0, E1, and E2 States of Mo N2ase.
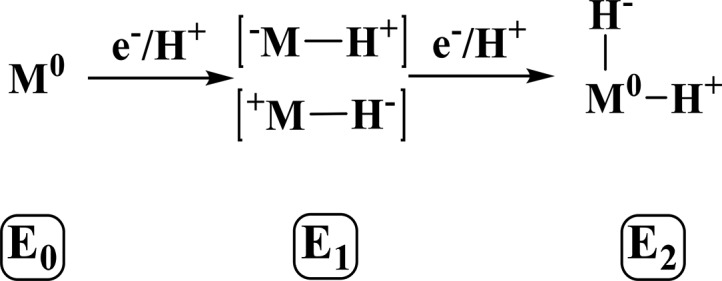
“M” is used to simply denote the entire FeMoco cluster rather than a particular binding site.
Herein, we employ a series of spectroscopic methods to elucidate the nature of the E1 and cryoreduced states of MoFe. We have employed low-flux turnover conditions ([MoFe]:[FeP] = 50:1) to generate favorable quantities of the E1 state, using X-band EPR to monitor the decrease of E0 and ensure that further reduced species are not formed. High-energy-resolution-fluorescence-detected (HERFD) and partial-fluorescence-detected (PFY) X-ray absorption spectroscopy (XAS) techniques are employed as element-selective and oxidation-state sensitive probes of Mo and Fe to elucidate the redox-active centers of the FeMoco cluster and provide insight into the relationship between the cryoreduced and native turnover states. Finally, 57Fe Mössbauer spectroscopy is used to reconcile the past and present observations of reduced FeMoco.
2. Materials and Methods
Materials and Protein Purifications
All reagents were obtained from Sigma-Aldrich (St. Louis, MO) or Fisher Scientific (Fair Lawn, NJ) and used without further purification. Ar and N2 gases were purchased from Air Liquide America Specialty Gases LLC (Plumsteadville, PA) and passed through an activated Cu catalyst to remove any traces of dioxygen before use. Azotobacter vinelandii strains DJ995 (wild-type MoFe protein with a His tag) and DJ 884 (wild-type FeP protein) were grown, and the corresponding His-tagged MoFe and FeP proteins were expressed and purified as described previously.49 The protein concentrations were determined by Biuret assay. The purities of these proteins were >95% based on sodium dodecyl sulfate polyacrylamide gel electrophoresis analysis with Coomassie staining. The MoFe and Fe proteins were fully active with specific activities. All manipulations of the proteins and buffers were performed in septum-sealed serum vials under an Ar atmosphere or on a Schlenk vacuum line. All liquids were transferred using gastight syringes.
Preparation of Cryoreduced Samples
Samples prepared for irradiation consisted of 520 μM MoFe in 100 mM 3-(N-morpholino)propanesulfonic acid (MOPS), 200 mM NaCl, and 20 mM sodium dithionite at pH 7.3 with 5% glycerol by volume. All samples in XAS sample holders were frozen and stored in liquid nitrogen before cryoreduction and further measurements. γ irradiation of the N2ase samples at 77 K was performed for approximately 6 h at a time (5 kGy h–1 for a 30 kGy total dose) using a Gammacell 220 60Co source. Annealing at 200 K was performed by placing samples in a liquid N2/pentane bath (cooled to 200 K) for 2 min, followed by refreezing in liquid N2. Reduction of E0 was monitored via EPR by reduction in the amplitude of the E0S = 3/2 signal at gmax = 4.34. Cryoreduced samples are denoted in the following text by their dose and annealing temperature (if annealed). For example, “30 kGy” refers to an unannealed sample of MoFe, which has been exposed to 30 kGy of radiation, while “30 kGy, 200 K” refers to a sample that has been irradiated with 30 kGy of radiation, followed by annealing at 200 K for 2 min.
Preparation of Native Turnover Samples
All native turnover XAS samples were prepared in a 200 mM MOPS buffer at pH 7.3 with an MgATP regeneration system (12 mM MgCl2, 20 mM phosphocreatine, 10 mM ATP, 1 mg mL–1 bovine serum albumin, and 0.4 mg mL–1 creatine phosphokinase), 50 mM NaCl, 50 mM sodium dithionite, and 5% (v/v) glycerol under Ar. The MoFe protein was added to a final concentration of 400 μM, and the reaction was initiated by the addition of FeP protein to a final concentration of 8 μM. After incubation at room temperature for about 10 min, the reaction mixture was transferred into the XAS sample holder and freeze-quenched in liquid N2. Samples were stored and shipped in liquid N2.
EPR Measurements
EPR spectra were recorded using a Bruker X-band ESP 300 spectrometer with an Oxford Instruments ESR 900 continuous-flow cryostat at 10 K. Quantitation of E0 reduction was performed by measuring the decrease in the intensity of the g1 feature at 4.34 of reduced samples relative to that of the resting state (see section S2 of the Supporting Information for measurements performed on the samples used for XAS measurements). This is possible because the intrinsic line width of the E0S = 3/2 signal and measurement conditions for each of these samples were identical. These results are corroborated by spin-integration (Table S1).
HERFD XAS Measurements
HERFD XAS data of all N2ase samples were obtained at the ID26 beamline at the European Synchrotron Radiation Facility (ESRF). The storage ring operated at 6 GeV in 16-bunch top-up mode and ∼90 mA ring current. A double-crystal monochromator using Si(311) crystals was used to select the incoming X-ray energy with an intrinsic resolution (ΔE/E) of 0.3 × 10⁻⁴. A liquid-He-flow cryostat was maintained at approximately 20 K in order to minimize radiation damage and to maintain an inert sample environment. A 1-m-radius multicrystal Johann-type X-ray spectrometer was used to select the energy of the emitted X-rays and record HERFD XAS data using a dead-time-corrected Ketek Si drift diode detector in a Rowland geometry. Standard XAS was also collected by total fluorescence yield simultaneously with HERFD measurements.
In the Mo XAS measurements, the energy of the incoming X-rays was calibrated by recording the transmission K-edge XAS spectrum of a Mo foil and assigning the energy of the maximum of the white line to 20016.4 eV. For Mo Kα HERFD measurements, the spectrometer was equipped with five curved Ge(111) crystals positioned at a Bragg angle of 77.74°, utilizing the [999] reflection to focus the Mo Kα1 emission (∼17480 eV) on the detector. Short XAS scans were collected by scanning the incident energy from 19990 to 20090 eV, while long XAS scans obtained for normalization were collected from 19910 to 20910 eV. Prior to measurements, each sample was checked for signs of radiation damage by performing subsequent short XAS scans from 19990 to 20090 eV on the same sample spot, using a rate of 5 s per scan. These tests showed that MoFe was stable under X-ray irradiation at the Mo K-edge for >300 s.
All Fe XAS measurements were calibrated by aligning the first inflection point of the HERFD XAS spectrum of a 10-μm-thick α-Fe foil layered in Kapton tape to 7111.2 eV. The spectrometer was equipped with five curved Ge(110) crystals positioned in a Roland geometry at a Bragg angle of ∼68°, using the [440] reflection to focus the Fe Kα1 emission (7467 eV) on the detector. Short XAS scans were collected by scanning the incident energy from 7100 to 7200 eV, while long XAS scans obtained for normalization were collected from 6930 to 7920 eV. Prior to measurements, each sample was checked for signs of radiation damage by performing subsequent short XAS scans from 7100 to 7200 eV on the same sample spot, using a rate of 5 s per scan. These tests showed that MoFe was stable under X-ray irradiation at the Fe K-edge for up to 120 s.
PFY XAS Measurements
XAS measurements of intact N2ase MoFe and Fe proteins were obtained at the 9-3 beamline of the Stanford Synchrotron Radiation Lightsource (SSRL). The SPEAR storage ring operated at 3.0 GeV in a top-off mode with a 500 mA ring current. A liquid-N2-cooled double-crystal monochromator using Si(220) crystals at ϕ = 0° was used to select the incoming X-ray energy with an intrinsic resolution (ΔE/E) of 0.6 × 10⁻⁴, and a Rh-coated mirror was used for harmonic rejection. The X-ray beam size was 1 × 4 mm2 (V × H) at the sample position. A liquid-He-flow cryostat was used to maintain at approximately 20 K sample environment in order to prevent radiation damage and maintain an inert sample environment. Fluorescence measurements were recorded using a Canberra 100-element Ge monolith solid-state detector. Prior to measurements, each sample was checked for signs of radiation damage by performing subsequent 5 min scans over the same sample spot. These tests showed that MoFe was stable under X-ray irradiation at the Mo K-edge for >90 min and at the Fe K-edge for >70 min.
Energy calibrations for the Mo and Fe K-edge XAS measurements were performed by recording the transmission K-edge XAS spectra of Mo and Fe foils, respectively, and assigning their energies, as detailed above in the HERFD XAS Measurements section. Full XAS scans at the Mo K-edge were collected by scanning the incident energy from 19780 to 21142 eV. All Fe XAS scans were collected by scanning the incident energy from 6882 to 8093 eV. Calibrations for each individual scan at both Mo and Fe K-edges were recorded simultaneously by measurements of the transmission of the respective metal foils.
XAS Data Processing
For all HERFD experiments, individual scans were normalized to the incident photon flux and averaged using PyMCA.50 Further processing of all spectra, including background subtraction and normalization, was performed using the Athena program from the software package Demeter,51 following standard protocols for X-ray spectroscopy.52,53 Background subtraction and normalization of the averaged Mo XAS spectra was performed using a linear regression for the preedge region of 19910–19947 eV and a quadratic polynomial regression for the postedge region of 20157–20807 eV. The Fe XAS spectra were processed in a fashion similar to that of the Mo XAS spectra. Background subtraction and normalization were performed using a linear regression for the preedge region of 6990–7005 eV and a quadratic polynomial regression for the postedge region of 7160–8200 eV. Statistical analyses of XAS measurements were performed by normalization of individual scans based on the edge area, followed by calculation of the standard deviation based on the deviation of individual scans from the average of all scans (eq 2).
| 2 |
where σ is the standard deviation, xi is an individual scan, xav is the average over all scans, and j is the total number of scans.
All spectral subtractions and manipulations were performed using normalized spectra. All XAS spectra in the main text are presented as “pure” spectra, in which contributions from the remaining resting (E0) state MoFe have been subtracted from the observed spectrum and the resulting spectrum of the “pure” species has been renormalized. The amount of remaining E0 in a given sample is based on the relative intensity of the E0S = 3/2 signal (as determined by EPR) relative to that of the resting state. Standard errors resulting from spectral subtractions involving removal of the resting state E0 contribution were propagated using eq 3:
| 3 |
where σxa–xb is the standard deviation of the renormalized spectrum generated by the subtraction of fraction xb of spectrum “b” from spectrum “a”. In all cases, xa = 1. Where difference spectra are presented, in which xb = 1, eq 3 simplifies to
| 4 |
57Fe Mössbauer Spectroscopy Measurements
57Fe Mössbauer spectra were recorded with a spectrometer using a Janis Research (Wilmington, MA) SuperVaritemp dewar, which allows studies in applied magnetic fields up to 8.0 T in a temperature range of 1.5–200 K. Isomer shifts are quoted relative to the α-Fe metal at 298 K. Mössbauer spectral simulations were performed using the local program mf (available from E.B.) using the minimum number of necessary quadrupole doublets to gauge the average isomer shift of each spectrum. The preparation of the resting state 57Fe Mössbauer sample was previously described.46
3. Results
EPR
During turnover in the absence of N2, the enzyme only accesses the E0–E4 states while generating H2, as depicted in Scheme 2. The EPR signals from the several E2 and E4 states are well characterized.4,37,38 Therefore, any intensity that is unaccounted for in the continuous-wave (CW) EPR when comparing samples of the resting E0 state and a turnover state can be associated with population of the E1 and E3 states. In the present study, low-electron flux conditions (enabled by a high [MoFe]:[FeP] ratio) have slowed reduction of the cluster to the point that the rate of H2 production from E2 is greater than the rate of E2 formation. This results in the population of only the E0 and E1 states, as confirmed by the absence of signals associated with the E2 state in any of the samples used in the present study (Figure S1).45,54
Cryoradiolysis at 77 K has previously been found to not only reduce the FeMoco cluster but also partially oxidize the P cluster despite the presence of glycerol, which favors the former.45Figure 1 shows the persistence of the S = 1/2 signal (g = 2.05, 1.95, and 1.81)55 corresponding to P+ in the cryoreduced samples, even after annealing at 200 K. The contribution of P+ can be roughly quantified based on the intensity of this feature relative to the S = 3/2 E0 signal (see section S2 of the Supporting Information for details). In doing so, we find that approximately 7% of the P cluster is oxidized in the irradiated samples.
Figure 1.
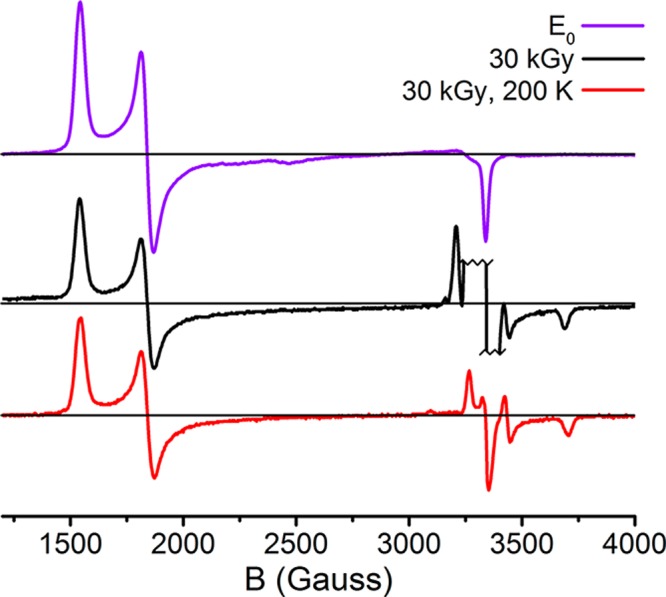
X-band CW EPR spectra of resting MoFe (E0), 30 kGy cryoreduced, and 30 kGy, 200 K annealed samples. The g ∼ 2 region of the 30 kGy spectrum is abbreviated because of the presence of large radical signals; these arise from free radicals generated by the irradiation procedure. Measurements were performed at 10 K, 9.371 GHz using a power of 2 mW and a 13 G modulation amplitude.
On the basis of such intensity measurements, samples trapped during turnover under Ar contain ∼55% E0, and the remaining ∼45% is assigned to E1, while resting-state samples cryoreduced with 30 kGy contain ∼60% E0 (and, therefore, ∼40% E1) and ∼7% P+ (Table S1).
Mo Kα HERFD XAS
A discussion of the changes that occur at the Mo K-edge upon reduction is provided in section S3 of the Supporting Information and demonstrated with a series of model complexes. Briefly, a one-electron reduction of MoIII is expected to result in a ∼ 1 eV decrease in energy of the edge, while the some variation in the preedge region is expected to occur depending on competing factors of centrosymmetry versus a reduced number of available holes in the valence shell.56 Upon inspection of Figure 2, we find that no significant changes occur in the Mo spectrum of MoFe during either native turnover (E1), following cryoreduction (30 and 60 kGy), or annealing of the cryoreduced sample (30 kGy, 200 K). While some slight variation occurs in the edge around 20010 eV, these changes are well within the standard error of the experiment (Figure S5) and not of the appropriate magnitude to substantiate an oxidation state change at Mo. Hence, in E0, natively reduced, and cryoreduced MoFe samples, Mo remains MoIII.
Figure 2.
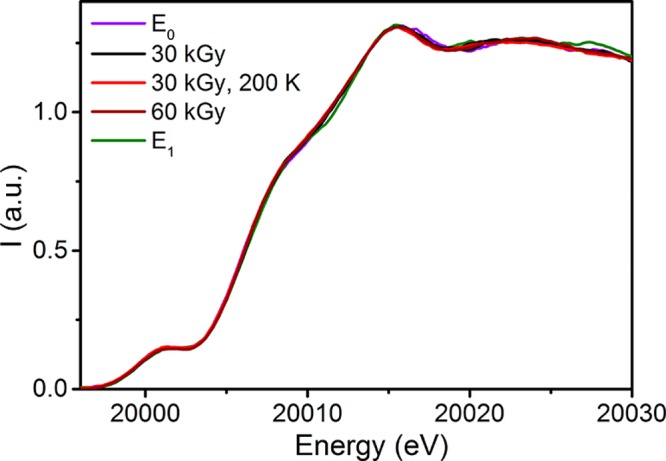
Comparison of the normalized Mo Kα HERFD XAS spectra of the MoFe samples under investigation. All XAS spectra (besides E0) are presented as renormalized “pure” species, in which any remaining E0 component (as determined by EPR, see section S2 of the Supporting Information) has been subtracted from the experimentally observed spectrum. Prior to any spectral subtractions, an 11-point boxcar average smoothing was applied.
Fe K-Edge XAS Considerations
Because XAS is a bulk technique and there are up to three unique Fe–S clusters present in these samples, it is naturally necessary to determine whether spectral changes that occur upon reduction are attributable to the FeMoco cluster, P-cluster, FeP, or some combination. During native turnover, single-electron transfer is accomplished in a stepwise fashion that is initiated by the binding of the reduced, ATP-bound form of the Fe N2ase protein (FePred). This binding event induces a conformationally gated one-electron transfer from the P-cluster to FeMoco, followed by the a one-electron transfer from FePred to P+ in what is referred to as a “deficit spending” electron-transfer process.57,58 This is followed by hydrolysis of ATP to ADP, the release of two Pi, and subsequent dissociation of FePox.59 This series can be summarized as follows:
Backfilling electron transfer from FePred to P+ occurs rapidly relative to the transfer from P to FeMoco.57 Therefore, under native turnover conditions, the bulk oxidation state of the P cluster remains invariant. In the native turnover samples used here, a 50:1 ratio of [MoFe]/[FeP] is used. Hence, FeP accounts for just 0.27% of the total Fe in these samples, and therefore the contribution of either FePred or FePox to the native turnover spectrum is negligible.
The cryoreduced samples lack FeP but exhibit the presence of a relatively small quantity of a one-electron-oxidized P cluster. Previous XAS studies of Pox have shown this species to have a decreased white-line intensity relative to PN between 7122 and 7132 eV, as well as small increases in the intensity at both the preedge and edge (Figure S20).60
Fe Kα HERFD and PFY
The Fe Kα HERFD of MoFe under cryoreducing conditions is provided in section S4 of the Supporting Information. Briefly, cryoreduction only results in minor increases in the intensity of the white-line region from 7125 to 7135 eV of approximately 1.2–2% of the total normalized intensity (Figure S4) when observed with this technique. This small degree of change is not surprising because 15 unique Fe centers contribute to MoFe, and formally we expect a single-oxidation-state change for one of these centers. On the basis of studies of model complexes and comparisons of the VFe and MoFe proteins, a white-line increase between 0.5 and 10% can be anticipated.61 This is also discussed in greater detail in section S4 of the Supporting Information.
One of the powerful advantages of HERFD XAS lies in its line-sharpening effect, a result of the narrow experimental energy bandwidth approaching that of the intrinsic lifetime broadening of the fluorescent event being observed.62,63 This is particularly useful for measurements of elements with larger Z (such as Mo), which have shorter 1s core–hole lifetimes and therefore greater lifetime broadening (as demonstrated in Figure S6).64 While line sharpening also occurs at Fe, it is less pronounced because of its longer core–hole lifetime.
Meanwhile, one of the primary disadvantages of HERFD is its utilization of an intrinsically small solid angle; this is necessary to select the very narrow range of fluorescent energies used in detection at the Kα line.65 This means that the amount of signal observed in HERFD measurements is usually quite low, making an intense, high-flux incoming X-ray beam necessary to produce substantial count rates. In turn, rapid scan times must be used to mitigate the damage that such a high-flux incident beam inflicts on the sample.52 When this is combined with the low count rates, which result from dilute protein solutions, the level of noise in individual scans becomes considerable. In the present case, despite extensive collection times, the statistical uncertainty in these spectra remains considerably greater than the small differences observed between the resting and cryoreduced/annealed samples. Figure S9 provides the difference spectra of the 30 and 60 kGy samples, where the standard error of these experiments ranges around ±2–3%.
To overcome the challenges presented when observing such a small degree of change (again, 1.2–2%), we elected to employ standard Fe K-edge PFY XAS to provide insight into the relationship between the resting, cryoreduced, and natively reduced systems. PFY XAS measurements utilize a larger solid angle and collect emitted fluorescent photons over a much larger range of energies, providing approximately an order of magnitude higher count rates than those observed by HERFD for similar samples. Additionally, significantly longer dwell times (30 min per scan) can be used for these measurements because of the use of a lower-flux incident beam distributed over a significantly larger spot size. This allows for data collection to be performed to a much higher confidence level, with up to several orders of magnitude reduction in standard deviation.
The Mo K-edge PFY XAS spectrum (Figure S7) shows no significant changes at the edge under any of the employed conditions, in agreement with the collected Mo Kα HERFD. The Fe K-edge PFY XAS measurements demonstrate a small degree of change similar to those observed using Fe Kα HERFD, on the order of up to 1.5% in the case of E1 (Figure 3). However, the drastic decrease in the standard error of these measurements makes such minor changes statistically significant (Figures 4 and S10–S13).
Figure 3.
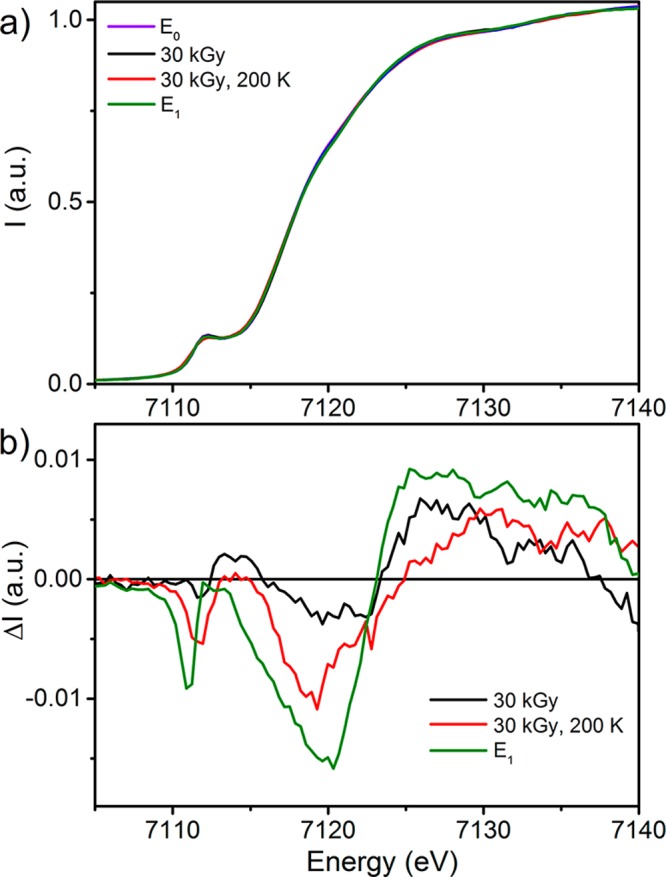
(Top) Comparison the Fe K-edge PFY XAS spectra of resting E0 (violet), E1 (green), 30 kGy, 200 K (red), and 30 kGy (black). (Bottom) Difference spectra generated by subtraction of the E0 spectrum from the E1 (green), 30 kGy (black), and 30 kGy, 200 K (red) spectra.
Figure 4.
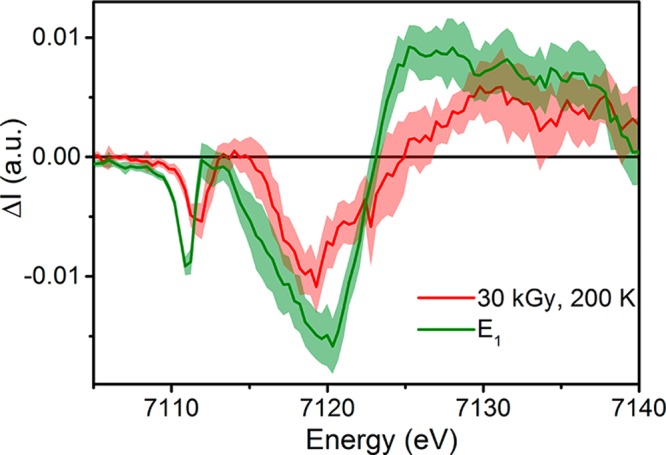
Comparison of the difference spectra generated by subtracting the Fe K-edge PFY spectrum of E0 from either E1 (green) or 30 kGy, 200 K (red). Standard deviations are shown as the partially transparent complimenting color. The 30 kGy spectrum is omitted here for clarity and is provided in section S4 of the Supporting Information.
Changes are observed in three regions of the spectrum upon native reduction of MoFe from the E0 to E1 state. Namely, a decrease in the preedge intensity from ∼7109 to 7113 eV is accompanied by a decrease in the edge intensity from 7113 to 7123 eV and an increase at the white line above 7123 eV. The difference spectrum of E1 – E0 provides a reference for the changes expected in the spectra following both reduction and proton transfer, which can now be used to analyze the spectra resulting from the cryoreduction and annealing of MoFe.
As discussed above, the cryoreduction of MoFe also results in partial oxidation of the P cluster. Therefore, all presented cryoreduced XAS spectra are convoluted to some degree by the partial population of P+. The Fe K-edge PFY XAS spectrum of Pox was previously reported60 and displayed a decrease in the white-line intensity, which was combined with a small increase in the intensity of both the preedge of ∼7112 eV and the edge around 7120 eV (Figure S20). These changes are essentially counteractive to the differences observed in the E1 spectrum, particularly at the white line. Therefore, it is not surprising that the 30 kGy cryoreduced sample exhibits only a small decrease in the edge intensity and a small increase in intensity at the white line, with no appreciable change at the preedge region. Upon annealing at 200 K, a decrease in the preedge intensity is observed along with a further decrease in the edge intensity to produce a spectrum similar to that of the native E1 sample (as illustrated in Figure S15).
57Fe Mössbauer Spectroscopy
To reconcile our current results from Fe XAS with those of the previous 57Fe Mössbauer spectroscopy of cryoreduced and natively reduced MoFe,46 we reinvestigated the 57Fe Mössbauer spectroscopy of cryoreduced MoFe to see if the cryoreduction/annealing protocol would reproduce the original isomer shift observed for the E1 state. While the XAS measurements observed all Fe present in the sample, 57Fe Mössbauer spectroscopy only observed 57Fe. Selective enrichment of the FeMoco cluster with 57Fe can be accomplished by enriching MoFe with 57Fe, extracting the enriched 57FeMoco cluster, and reconstituting this cluster into unenriched ΔnifB FeMoco-deficient MoFe.46,49 In this way, one can generate a Mössbauer sample that is solely sensitive to the FeMoco cluster. This was done previously,46 and a sample of selectively enriched 57FeMoco-enriched MoFe from this original study was obtained and measured in the resting, cryoreduced, and cryoreduced/200 K annealed states to gauge the change in the average isomer shift (δavg), and therefore Fe oxidation state, in these three states.
It is not surprising that very little change is observed between these three states, shown in Figure 5, because only a single-oxidation-state change at one of the seven Fe sites of FeMoco is expected. However, these small changes can still be quantified through fitting. A unique fit of the 57Fe Mössbauer spectra of the FeMoco cluster requires a considerable amount of information that is currently unavailable for E1, including an approximation of the individual Fe hyperfine tensors and their Euler angles. However, the average isomer shifts can still be obtained from the collapsed quadrupole spectra measured ∼90 K using a minimalist fitting procedure to account for the absorption intensity (Figure S22). In this way, the spectra were adequately fit using two quadrupole doublets for the E0 spectrum and three for the 30 kGy and 30 kGy, 200 K spectra. The results of these fits are summarized in Table 1.
Figure 5.
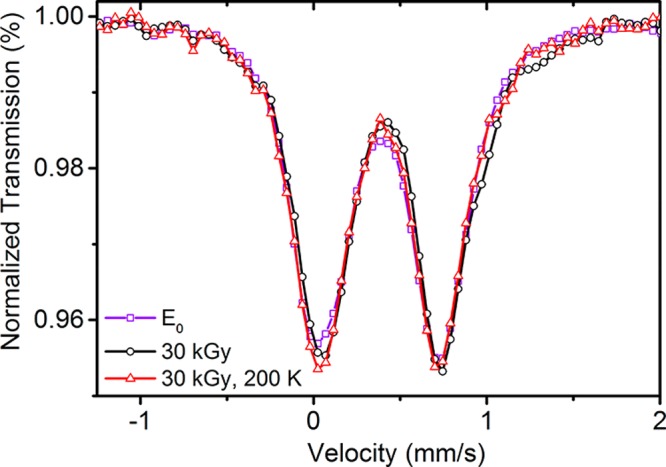
Comparison of the experimental resting E0 (violet), 30 kGy (black), and 30 kGy, 200 K (red) 57Fe Mössbauer spectra of a selectively 57FeMoco/56P-cluster-enriched MoFe sample. On the basis of EPR, the 30 kGy and 30 kGy, 200 K spectra contain ∼60% E0. The spectra were collected under the following conditions: E0 (100 K, 0 T), 30 kGy (90 K, 0.1 T), and 30 kGy, 200 K (90 K, 0 T). Errors and difference spectra are provided in section S6 of the Supporting Information.
Table 1. Summary of 57Fe Mössbauer Fits of E0, 30 kGy, and 30 kGy, 200 K Samplesa.
The average isomer shift of each species is formulated by the weighted average of the isomer shifts of its individual components.
Discrepancies in the absolute isomer shift of E0 between the present and previous studies arise from the temperature-dependent second-order Doppler shift.46
Calculated by subtraction of δ(E0).
Adjusted for the presence of E0 (in the present samples, this was performed by multiplication of Δδavg by 2.5 to account for the ∼60% E0 present).
The observed changes in the isomer shift are small but close to those expected based on previous findings.46 Once the presence of E0 in the 30 kGy and 30 kGy, 200 K samples is compensated for, we find a shift of +0.07 mm s–1 upon moving from E0 to 30 kGy. This is slightly greater than that previously found for MI, where +0.05 mm s–1 was observed with an unreported dose of radiation.46 Upon annealing, the change in the isomer shift relative to E0 is reduced to Δδavg = 0.02 mm s–1, similar to the previously reported species MR (assigned as E1).46
4. Discussion
Context of the E1 Oxidation State
Few previous investigations have specifically aimed at exploring the electronic and geometric structures of the E1 state of MoFe, and no conclusive evidence has been provided regarding the site of reduction on the FeMoco cluster in E1.66,67 To this end, perhaps the most significant effort undertaken to date involved the measurement of selectively 57FeMoco-enriched MoFe using 57Fe Mössbauer spectroscopy to ascertain the electronic properties of the catalytic cluster across a series of oxidation states.46 More specifically, the one-electron-oxidized (Mox), resting (MN), low-flux turnover (5:1 [MoFe]/[FeP], referred to as “MR”), and cryoreduced (MI) states were measured and their isomer shifts δ determined. The isomer shift δ is diagnostic of Fe oxidation state, particularly for similar or identical complexes in a series of oxidation states. Considering that a typical change in the isomer shift (Δδ) of ∼0.45 mm s–1 is observed upon moving from ferric to ferrous FeS4, a change in the overall oxidation state of −1 for the seven Fe sites found in FeMoco is expected to produce an increase of 0.06 mm s–1 in the average isomer shift. This was indeed observed upon a comparison of the MN and Mox states. Similarly, MI exhibited a similar change of Δδ ≈ 0.05 mm s–1 relative to MN. However, a considerably smaller shift was seen upon a comparison of MR and MN (Δδ ≈ 0.02 mm s–1). The discrepancy of Δδ between MI and MR led to the proposal that MI represented a unique species and that the series moving from Mox to MN to MI involved sequential additions of electrons to the Fe centers of FeMoco. Meanwhile, the smaller Δδ observed in MR was proposed, by inference, to be a Mo reduced state.46 These results had significant implications, not only in that Mo, rather than Fe, was reduced in the E1 state of MoFe but also in that the method of reduction determined the identity of the resulting species.
At the time of the study, it was generally accepted that the resting state of FeMoco contained MoIV based on previous ENDOR and XAS studies,68−71 reasonably suggesting that native reduction could result in the formation of MoIII. More recently, however, Mo Kα HERFD and L-edge XAS have been used to demonstrate that the oxidation state of Mo in the resting E0 state of Mo N2ase is best described as MoIII in a non-Hund electronic configuration.56,72 Therefore, if a Mo-centered reduction does indeed occur upon the initial reduction of the FeMoco cluster, a formal MoII center would be generated during native turnover.
Implications of Mo Redox Innocence
Because the Mo of FeMoco is the only Mo site in MoFe, the changes expected to occur upon reduction should be on the same order of magnitude as those observed upon comparison to reference MoIV and MoIII, particularly in terms of the change in energy of the preedge and edge features (−1 eV for a one-electron reduction; section S3 of the Supporting Information). From the present Mo Kα HERFD XAS spectrum (Figure 2), it is clear that no significant spectral changes occur at the Mo site of MoFe during native low-flux turnover or upon cryoreduction, which implies that Mo is not redox-active under the conditions utilized in this study.
Besides the implication of these results in assigning the oxidation state of Mo, we note that observing no significant changes in the preedge region of the spectrum was initially surprising based on the previous literature. More specifically, previous reports of the Mo and Fe K-edge extended X-ray absorption fine structure of MoFe under native turnover proposed that significant contractions of the Mo–Fe and Mo–O/N distances of −0.06 and −0.07 Å were found for the E1 state.67 It is already known that the Mo K-edge is fairly sensitive to the coordination environment,64,73 and one would anticipate that such drastic changes in the first coordination sphere of Mo should result in noticeable changes in the preedge/edge features when measured using Kα HERFD; however, none are observed here, implying that Mo coordination does not change upon formation of E1. Unfortunately, the near-edge spectra (commonly referred to as XANES) were not reported in this previous study.
In a similar vein, it was hypothesized that homocitrate, which binds the Mo of FeMoco in the resting state, plays an essential role in proton relay to the FeMoco cluster during catalysis.74 Computational studies on a model of the E4 state of FeMoco have suggested that Mo may shift from 6- to 5-coordinate during turnover as the Mo-coordinating homocitrate becomes protonated.75 Lowering of coordination would result in a lower approximate symmetry at Mo (from C2 to C1) and correspondingly an increase in the XAS preedge intensity. We do not observe any such changes presently, again suggesting that Mo remains 6-coordinate in E1.
Fe K-Edge XAS of E1 and Cryoreduced States
As indicated by the Fe K-edge PFY XAS spectra presented in Figures 3 and 4, reduction of E0 to E1 results in a decrease in the intensity at both the preedge and edge regions and an increase in the intensity at the white line. Generally, the preedge feature of transitions metals with partially filled valence orbitals is expected to weaken as the oxidation state is decreased, assuming that no extreme perturbations in geometry or covalency occur.76−78 It is well-established that fewer available holes in the metal d shell can result in a decrease in the intensity of the preedge feature. Thus, the results in Figures 3 and 4 are indicative that the E1 state is generated through an Fe-centered reduction.
The position of the edge is another typical diagnostic of the metal oxidation state, which is expected to decrease in energy upon reduction (for an example, see Figure S16). Therefore, at face value the decreased intensity observed for E1 in this region appears to indicate oxidation, which would contradict the interpretation of the changes that occur in the preedge region. However, there are several examples of FeS clusters that do not exhibit a change in energy at the edge region upon reduction.60,61,79 This is often attributed to the high covalency of Fe–S bonds, where metal-centered oxidation state changes can be muted through changes in the Fe–S covalency79−81 However, whether or not a shift in the edge position occurs upon reduction/oxidation of these systems also heavily depends on the mixed-valent nature of the new state being generated. As an example, the oxidation states at Fe in a symmetric [2Fe–2S]+ cluster may appear as either 2Fe2.5+ or FeIII/FeII depending on the degree of mixed valency (as well as experimental conditions in the case of Robin-Day class II82 mixed-valent complexes). As a result, the edge of the XAS spectrum may appear either halfway between that of the 2FeIII and 2FeII states (in the case of 2Fe2.5+) or as a convolution of the 2FeIII and 2FeII states. In the latter case, the position of the edge will be dominated by the FeII center and will therefore appear at the same energy as the 2FeII dimer. This behavior has been previously characterized in the [Et4N]n[LFe2S2]n− (n = 1, 2, 3) series,79 where the localized mixed-valent character of the n = 2 species results in the same edge energy as the n = 3 species in this complex (Figure S19). This is nearly identical with what we observe in Figures 3 and 4 for the E1 state, rationalizing the observed decrease in the edge intensity and further supporting an Fe-based reduction in E1.
Last, the white-line region generally results from strongly allowed electronic transitions that are confined to the vicinity of the absorbing atom or low-energy continuum states confined by strong multiple scattering. These states are difficult to predict and thus are less well understood than the transitions that contribute to the preedge and edge regions. However, this region can still be used as a fingerprint for the chemical bonding, oxidation state, and three-dimensional environment of the absorber. This region has been seen to increase in intensity with decreasing oxidation state not only for FeP and the P cluster60,80 but also in FeS model complexes.61,79 The changes that occur in the white line of the Fe XANES spectrum upon formation of E1 are therefore also consistent with an Fe-centered reduction.
With our consideration of E1 formed during native turnover in hand, we now turn to the cryoreduced species. Similar to E1, a decrease in the edge intensity coupled with an increase in the white-line intensity is seen in the 30 kGy sample, albeit to a smaller degree. It is notable that there is no significant decrease in the preedge intensity. Meanwhile, annealing of the 30 kGy cryoreduced sample results in a decreased preedge intensity, as well as a further decrease in the edge intensity. This produces a difference spectrum that is very similar to that of the E1 state (Figure 3). While some discrepancies do exist, particularly in the degree to which the intensities of the preedge and edge are decreased, it is important to keep in mind that ∼7% of the P cluster in these cryoreduced samples is present as P+. On the basis of previous XAS studies of PN/P+, any P+ present is expected to increase the preedge and edge intensities, while significantly decreasing the white-line intensity (Figure S20).60 These contributions directly correlate with the discrepancies between the E1 and 30 kGy, 200 K samples. This further supports the hypothesis that the differences between the cryoreduced and E1 states are not due to Fe versus Mo reduction but instead to the fact that the cryoreduced state has not yet acquired a proton (Scheme 1).
These results are further corroborated by the 57Fe Mössbauer spectroscopy results. Similar to the previously reported study of cryoreduced MoFe, we observe a change in the isomer shift of Δδavg = 0.07 mm s–1 following cryoreduction using 30 kGy of radiation once the remaining contributions of E0 are accounted for (compared to the 0.05 mm s–1 produced using an unspecified dose). Because there are seven Fe sites present in FeMoco, this corresponds to a Δδavg = 0.49 mm s–1 at a single Fe site, consistent with an Fe-centered reduction. This is not intended to imply that this additional electron is fully delocalized over all seven Fe sites. Annealing of this sample at 200 K produces a shift of Δδavg = 0.02 mm s–1, identical with that observed previously for E1.46 This is equivalent to a much smaller Δδavg = 0.14 mm s–1 shift for a single Fe site. This considerably smaller shift is intriguing because it implies that the additional electron contained in the E1 state is either fairly delocalized, involved in a highly covalent interaction, or both. Whether this can be attributed to iron hydride formation or the protonation of one of the S atoms in FeMoco remains unclear. What is perhaps clearer is that in either scenario the reducing equivalent appears to be distributed in such a manner as to minimize the apparent change in the oxidation state of the cluster, supporting the hypothesis that protonation of the cluster serves to level its reduction potential.
Thus far, the Fe K-edge XAS and 57Fe Mössbauer spectroscopy results support that (a) E1 trapped during turnover consists of an Fe-reduced state and (b) annealing of the cryoreduced state produces E1. Why then does the E1 state appear more reduced in the Fe K-edge XAS, while the cryoreduced state appears more reduced in the 57Fe Mössbauer spectroscopy? This is partially explained by the presence of ∼7% P+ in the cryoreduced samples that is observed in the XAS but not in the Mössbauer spectroscopy. However, even though the 30 kGy and 30 kGy, 200 K samples both contain the same contribution from P+, the 30 kGy, 200 K sample still appears more reduced in the XAS and less reduced in the Mössbauer spectroscopy. This implies that more must occur at the FeMoco cluster to generate E1 than simply the transfer of an electron and a proton; rather, it appears that a degree of electronic reorganization is also necessary. This kind of phenomenon has already been observed in previous cryoreduction studies of MoFe, where cryoreduction of the samples of E1 resulted in a unique S = 1/2 species rather than the S = 3/2 species of E245 and may very well occur here.
5. Conclusions
The present study has interrogated the behavior of both Mo and Fe of MoFe under both low-flux turnover and cryoreducing conditions. The results of the Mo Kα HERFD XAS demonstrate clearly that one-electron reduction of MoFe does not result in a Mo-centered reduction under either of these conditions. Fe K-edge XAS measurements further demonstrate that an Fe-centered redox event occurs under both native turnover and cryoreducing conditions, which is attributable to the FeMoco cluster on the basis of EPR. The changes observed upon moving from E0 to E1 are consistent with the one-electron reduction of Fe at FeMoco. While only minor changes are observed in the Fe K-edge XAS of MoFe following 30 kGy of irradiation, annealing of this sample for 2 min at 200 K generates a species closely related to E1. The differences between E1 and this cryoreduced/annealed species is accounted for by the presence of P+ in the latter, which is also generated during cryoreduction. These results are further supported by 57Fe Mössbauer spectroscopy, where the same change in the isomer shift Δδavg as that previously reported for the E1 state is observed following cryoreduction/annealing. On these bases, our results support the hypothesis that the states of FeMoco in cryoreduced MoFe and natively reduced E1 are related to one another through proton transfer. Building from previous studies, we propose that the metal valencies of the E1 state follow a [MoIII4FeII3FeIII] distribution.
The present work provides significant insight into the nature of the E1 state of MoFe and clearly establishes the redox innocence of Mo in the reduction of resting state (E0) N2ase to the E1 state. This work demonstrates that Fe is reduced in the E1 state and that both low-flux turnover and cryoreduction can function as a route to populating this state. These results provide crucial information for mechanistic studies in terms of possible electron distributions and variation in the coordination environment of the metal centers of the catalytic cluster and serve as a guide for further studies regarding the precise nature of E1.
Acknowledgments
All authors thank Eckard Münck for providing the selectively 57Fe-enriched sample used in the Mössbauer spectroscopy portion of this study. C.V.S., E.B., and S.D. thank the Max-Planck Society for funding. S.D. acknowledges the European Research Council under the European Union’s Seventh Framework Programme (FP/2007-2013) ERC Grant Agreement 615414, and both S.D. and C.V.S. acknowledge the DFG SPP 1927 “Iron–Sulfur for Life” (Project DE 1877/1-1) for funding. C.V.S. additionally thanks the IMPRS-RECHARGE for funding. Stefan Hugenbruch, Rebeca Gómez Castillo, Natalia Levin Rojas, and Patricia Rodriguez Macia are thanked for their assistance in the collection of XAS data. Justin Henthorn is thanked for providing the MoIII and MoIV model complexes. ESRF and SSRL are acknowledged for allocating beamtime. Use of the SSRL is supported by the U.S. Department of Energy (DOE), Office of Science, Office of Basic Energy Sciences, under Contract DE-AC02-76SF00515. Dr. Blanka Detlefs at beamline ID26 (ESRF), Grenoble, France, and Dr. Matthew Latimer and Dr. Erik Nelson at beamline 9-3 (SSRL), Menlo Park, CA, are gratefully acknowledged for their technical assistance. Open access funding was provided by the Max Planck Society. L.C.S. was supported by a grant from the U.S. DOE, Office of Science, Basic Energy Sciences (Grant DESC0010687). B.M.H. was supported by the National Institutes of Health (Grant GM111097) and Y.G. by the National Science Foundation (Grant CHE1654060).
Supporting Information Available
The Supporting Information is available free of charge on the ACS Publications website at DOI: 10.1021/acs.inorgchem.9b01951.
Preparation of the reference model complexes and more detailed spectroscopic data and analysis (PDF)
The authors declare no competing financial interest.
Supplementary Material
References
- Smil V.Enriching the Earth: Fritz Haber, Carl Bosch, and the Transformation of World Food Production; MIT Press: Cambridge, MA, 2001. [Google Scholar]
- Boyd E. S.; Anbar A. D.; Miller S.; Hamilton T. L.; Lavin M.; Peters J. W. A late methanogen origin for molybdenum-dependent nitrogenase. Geobiology 2011, 9, 221–32. 10.1111/j.1472-4669.2011.00278.x. [DOI] [PubMed] [Google Scholar]
- Burgess B. K.; Lowe D. J. Mechanism of Molybdenum Nitrogenase. Chem. Rev. 1996, 96, 2983–3012. 10.1021/cr950055x. [DOI] [PubMed] [Google Scholar]
- Hoffman B. M.; Lukoyanov D.; Yang Z.-Y.; Dean D. R.; Seefeldt L. C. Mechanism of Nitrogen Fixation by Nitrogenase: The Next tage. Chem. Rev. 2014, 114, 4041–62. 10.1021/cr400641x. [DOI] [PMC free article] [PubMed] [Google Scholar]
- Bulen W. A.; LeComte J. R. The nitrogenase system from Azotobacter: two-enzyme requirement for N2 reduction, ATP-dependent H2 evolution, and ATP hydrolysis. Proc. Natl. Acad. Sci. U.S.A. 1966, 56, 979–986. 10.1073/pnas.56.3.979. [DOI] [PMC free article] [PubMed] [Google Scholar]
- Chatt J.; Dilworth J. R.; Richards R. L. Recent Advances in the Chemistry of Nitrogen Fixation. Chem. Rev. 1978, 78, 589–625. 10.1021/cr60316a001. [DOI] [Google Scholar]
- Hussain W.; Leigh G. J.; Pickett C. J. Stepwise Conversion of Dinitrogen Co-ordinated to Molybdenum into an Amine and an Imido-complex. Relevance to the Reactions of Nitrogenase. J. Chem. Soc., Chem. Commun. 1982, 747–748. 10.1039/c39820000747. [DOI] [Google Scholar]
- Pickett C. J. The Chatt cycle and the mechanism of enzymic reduction of molecular nitrogen. JBIC, J. Biol. Inorg. Chem. 1996, 1, 601–606. 10.1007/s007750050099. [DOI] [Google Scholar]
- Schrock R. R. Catalytic Reduction of Dinitrogen to Ammonia at a Single Molybdenum Center. Acc. Chem. Res. 2005, 38, 955–62. 10.1021/ar0501121. [DOI] [PMC free article] [PubMed] [Google Scholar]
- Yandulov D. V.; Schrock R. R. Reduction of Dinitrogen to Ammonia at a Well-Protected Reaction Site in a Molybdenum Triamidoamine Complex. J. Am. Chem. Soc. 2002, 124, 6252–6253. 10.1021/ja020186x. [DOI] [PubMed] [Google Scholar]
- Shilov A. E. Catalytic reduction of dinitrogen in protic media: chemical models of nitrogenase. J. Mol. Catal. 1987, 41, 221–234. 10.1016/0304-5102(87)80030-5. [DOI] [Google Scholar]
- Yandulov D. V.; Schrock R. R. Catalytic Reduction of Dinitrogen to Ammonia at a Single Molybdenum Center. Science 2003, 301, 76–8. 10.1126/science.1085326. [DOI] [PubMed] [Google Scholar]
- Lee S. C.; Holm R. H. The Clusters of Nitrogenase: Synthetic Methodology in the Construction of Weak-Field Clusters. Chem. Rev. 2004, 104, 1135–58. 10.1021/cr0206216. [DOI] [PubMed] [Google Scholar]
- Malinak S. M.; Coucouvanis D. The Chemistry of Synthetic Fe-Mo-S Clusters and their Relevance to the Structure and Function of the Fe-Mo-S Center in Nitrogenase. Prog. Inorg. Chem. 2007, 49, 599–662. 10.1002/9780470166512.ch6. [DOI] [Google Scholar]
- Arashiba K.; Miyake Y.; Nishibayashi Y. A molybdenum complex bearing PNP-type pincer ligands leads to the catalytic reduction of dinitrogen into ammonia. Nat. Chem. 2011, 3, 120–5. 10.1038/nchem.906. [DOI] [PubMed] [Google Scholar]
- Arashiba K.; Nakajima K.; Nishibayashi Y. Synthesis and Reactivity of Molybdenum-Dinitrogen Complexes Bearing PNN-Type Pincer Ligand. Z. Anorg. Allg. Chem. 2015, 641, 100–104. 10.1002/zaac.201400117. [DOI] [PubMed] [Google Scholar]
- Itabashi T.; Mori I.; Arashiba K.; Eizawa A.; Nakajima K.; Nishibayashi Y. Effect of substituents on molybdenum triiodide complexes bearing PNP-type pincer ligands toward catalytic nitrogen fixation. Dalton Trans. 2019, 48, 3182–3186. 10.1039/C8DT04975K. [DOI] [PubMed] [Google Scholar]
- Jia H. P.; Quadrelli E. A. Mechanistic aspects of dinitrogen cleavage and hydrogenation to produce ammonia in catalysis and organometallic chemistry: relevance of metal hydride bonds and dihydrogen. Chem. Soc. Rev. 2014, 43, 547–64. 10.1039/C3CS60206K. [DOI] [PubMed] [Google Scholar]
- Khoenkhoen N.; de Bruin B.; Reek J. N. H.; Dzik W. I. Reactivity of Dinitrogen Bound to Mid- and Late-Transition-Metal Centers. Eur. J. Inorg. Chem. 2015, 2015, 567–598. 10.1002/ejic.201403041. [DOI] [Google Scholar]
- Kuriyama S.; Arashiba K.; Nakajima K.; Tanaka H.; Kamaru N.; Yoshizawa K.; Nishibayashi Y. Catalytic formation of Ammonia from Molecular Dinitrogen by Use of Dinitrogen-Bridged Dimolybdenum-Dinitrogen Complexes Bearing PNP-pincer Ligands: Remarkable Effect of Substituent at PNP-Pincer Ligand. J. Am. Chem. Soc. 2014, 136, 9719–31. 10.1021/ja5044243. [DOI] [PubMed] [Google Scholar]
- Kuriyama S.; Arashiba K.; Nakajima K.; Tanaka H.; Yoshizawa K.; Nishibayashi Y. Nitrogen fixation catalyzed by ferrocene-substituted dinitrogen-bridged dimolybdenum-dinitrogen complexes: unique behavior of ferrocene moiety as redox active site. Chem. Sci. 2015, 6, 3940–3951. 10.1039/C5SC00545K. [DOI] [PMC free article] [PubMed] [Google Scholar]
- Nishibayashi Y.Transition Metal–Dinitrogen Complexes: Preparation and Reactivity; Wiley-VCH, 2019; p 496. [Google Scholar]
- Spatzal T.; Perez K. A.; Einsle O.; Howard J. B.; Rees D. C. Ligand binding to the FeMo-cofactor: structures of CO-bound and reactivated nitrogenase. Science 2014, 345, 1620–3. 10.1126/science.1256679. [DOI] [PMC free article] [PubMed] [Google Scholar]
- Pollock R. C.; Lee H.-I.; Cameron L. M.; DeRose V. J.; Hales B. J.; Orme-Johnson W. H.; Hoffman B. M. Investigation of CO Bound to Inhibited Forms of Nitrogenase MoFe Protein by 13C ENDOR. J. Am. Chem. Soc. 1995, 117, 8686–8687. 10.1021/ja00138a033. [DOI] [Google Scholar]
- Barney B. M.; Igarashi R. Y.; Dos Santos P. C.; Dean D. R.; Seefeldt L. C. Substrate Interaction at an Iron-Sulfur Face of the FeMo-cofactor during Nitrogenase Catalysis. J. Biol. Chem. 2004, 279, 53621–53624. 10.1074/jbc.M410247200. [DOI] [PubMed] [Google Scholar]
- Barney B. M.; Laryukhin M.; Igarashi R. Y.; Lee H.-I.; Dos Santos P. C.; Yang T.-C.; Hoffman B. M.; Dean D. R.; Seefeldt L. C. Trapping a Hydrazine Reduction Intermediate on the Nitrogenase Active Site. Biochemistry 2005, 44, 8030–7. 10.1021/bi0504409. [DOI] [PubMed] [Google Scholar]
- Barney B. M.; Lukoyanov D.; Igarashi R. Y.; Laryukhin M.; Yang T.-C.; Dean D. R.; Hoffman B. M.; Seefeldt L. C. Trapping an intermediate of dinitrogen (N2) reduction on nitrogenase. Biochemistry 2009, 48, 9094–102. 10.1021/bi901092z. [DOI] [PMC free article] [PubMed] [Google Scholar]
- Barney B. M.; Lukoyanov D.; Yang T.-C.; Dean D. R.; Hoffman B. M.; Seefeldt L. C. A methyldiazene (HN=N-CH3)-derived species bound to the nitrogenase active-site FeMo cofactor: Implications for mechanism. Proc. Natl. Acad. Sci. U. S. A. 2006, 103, 17113–8. 10.1073/pnas.0602130103. [DOI] [PMC free article] [PubMed] [Google Scholar]
- Lowe D. J.; Thorneley R. N. F. The mechanism of Klebsiella pneumoniae nitrogenase action. Pre-steady-state kinetics of H2 formation. Biochem. J. 1984, 224, 877–86. 10.1042/bj2240877. [DOI] [PMC free article] [PubMed] [Google Scholar]
- Lowe D. J.; Thorneley R. N. F. The mechanism of Klebsiella pneumoniae nitrogenase action. The determination of rate constants required for the simulation of the kinetics of N2 reduction and H2 evolution. Biochem. J. 1984, 224, 895–901. 10.1042/bj2240895. [DOI] [PMC free article] [PubMed] [Google Scholar]
- Thorneley R. N. F.; Lowe D. J. The mechanism of Klebsiella pneumoniae nitrogenase action. Pre-steady-state kinetics of an enzyme-bound intermediate in N2 reduction and of NH3 formation. Biochem. J. 1984, 224, 887–94. 10.1042/bj2240887. [DOI] [PMC free article] [PubMed] [Google Scholar]
- Thorneley R. N. F.; Lowe D. J. The mechanism of Klebsiella pneumoniae nitrogenase action. Simulation of the dependences of H2-evolution rate on component-protein concentration and ratio and sodium dithionite concentration. Biochem. J. 1984, 224, 903–9. 10.1042/bj2240903. [DOI] [PMC free article] [PubMed] [Google Scholar]
- Burgess B. K.; Wherland S.; Newton W. E.; Stiefel E. I. Nitrogenase Reactivity: Insight into the Nitrogen-Fixing Process through Hydrogen-Inhibition and HD-Forming Reactions. Biochemistry 1981, 20, 5140–5146. 10.1021/bi00521a007. [DOI] [PubMed] [Google Scholar]
- Guth J. H.; Burris R. H. Inhibition of Nitrogenase-Catalyzed NH3 Formation by H2. Biochemistry 1983, 22, 5111–5122. 10.1021/bi00291a010. [DOI] [PubMed] [Google Scholar]
- Rivera-Ortiz J. M.; Burris R. H. Interactions Among Substrates and Inhibitors of Nitrogenase. J. Bacteriol. 1975, 123, 537–545. [DOI] [PMC free article] [PubMed] [Google Scholar]
- Watt G. D.; Bulen W. A.; Burns A.; Hadfield K. L. Stoichiometry, ATP/2e Values, and Energy Requirements for Reactions Catalyzed by Nitrogenase from Azotobacter vinelandii. Biochemistry 1975, 14, 4266–4272. 10.1021/bi00690a019. [DOI] [PubMed] [Google Scholar]
- Lukoyanov D.; Khadka N.; Yang Z.-Y.; Dean D. R.; Seefeldt L. C.; Hoffman B. M. Reductive Elimination of H2 Activates Nitrogenase to Reduce the N≡N Triple Bond: Characterization of the E4(4H) Janus Intermediate in Wild-Type Enzyme. J. Am. Chem. Soc. 2016, 138, 10674–83. 10.1021/jacs.6b06362. [DOI] [PMC free article] [PubMed] [Google Scholar]
- Lukoyanov D. A.; Khadka N.; Yang Z.-Y.; Dean D. R.; Seefeldt L. C.; Hoffman B. M. Hydride Conformers of the Nitrogenase FeMo-cofactor Two-Electron Reduced State E2(2H), Assigned Using Cryogenic Intra Electron Paramagnetic Resonance Cavity Photolysis. Inorg. Chem. 2018, 57, 6847–6852. 10.1021/acs.inorgchem.8b00271. [DOI] [PMC free article] [PubMed] [Google Scholar]
- Brown K. A.; Harris D. F.; Wilker M. B.; Rasmussen A.; Khadka N.; Hamby H.; Keable S.; Dukovic G.; Peters J. W.; Seefeldt L. C.; King P. W. Light-driven dinitrogen reduction catalyzed by a CdS:nitrogenase MoFe protein biohybrid. Science 2016, 352, 448–50. 10.1126/science.aaf2091. [DOI] [PubMed] [Google Scholar]
- Danyal K.; Rasmussen A. J.; Keable S. M.; Inglet B. S.; Shaw S.; Zadvornyy O. A.; Duval S.; Dean D. R.; Raugei S.; Peters J. W.; Seefeldt L. C. Fe Protein-Independent Substrate Reduction by Nitrogenase MoFe Protein Variants. Biochemistry 2015, 54, 2456–62. 10.1021/acs.biochem.5b00140. [DOI] [PubMed] [Google Scholar]
- Paengnakorn P.; Ash P. A.; Shaw S.; Danyal K.; Chen T.; Dean D. R.; Seefeldt L. C.; Vincent K. A. Infrared spectroscopy of the nitrogenase MoFe protein under electrochemical control: potential-triggered CO binding. Chem. Sci. 2017, 8, 1500–1505. 10.1039/C6SC02860H. [DOI] [PMC free article] [PubMed] [Google Scholar]
- Roth L. E.; Tezcan F. A. ATP-Uncoupled, Six-Electron Photoreduction of Hydrogen Cyanide to Methane by the Molybdenum–Iron Protein. J. Am. Chem. Soc. 2012, 134, 8416–8419. 10.1021/ja303265m. [DOI] [PubMed] [Google Scholar]
- Roth L. E.; Nguyen J. C.; Tezcan F. A. ATP- and Iron-Protein-Independent Activation of Nitrogenase Catalysis by Light. J. Am. Chem. Soc. 2010, 132, 13672–13674. 10.1021/ja1071866. [DOI] [PubMed] [Google Scholar]
- Davydov R.; Hoffman B. M. Active intermediates in heme monooxygenase reactions as revealed by cryoreduction/annealing, EPR/ENDOR studies. Arch. Biochem. Biophys. 2011, 507, 36–43. 10.1016/j.abb.2010.09.013. [DOI] [PMC free article] [PubMed] [Google Scholar]
- Davydov R.; Khadka N.; Yang Z.-Y.; Fielding A. J.; Lukoyanov D.; Dean D. R.; Seefeldt L. C.; Hoffman B. M. Exploring Electron/Proton Transfer and Conformational Changes in the Nitrogenase MoFe Protein and FeMo-cofactor Through Cryoreduction/EPR Measurements. Isr. J. Chem. 2016, 56, 841–851. 10.1002/ijch.201600026. [DOI] [PMC free article] [PubMed] [Google Scholar]
- Yoo S. J.; Angove H. C.; Papaefthymiou V.; Burgess B. K.; Münck E. Mössbauer Study of the MoFe Protein of Nitrogenase from Azotobacter vinelandii Using Selective 57Fe Enrichment of the M-Centers. J. Am. Chem. Soc. 2000, 122, 4926–4936. 10.1021/ja000254k. [DOI] [Google Scholar]
- Igarashi R. Y.; Laryukhin M.; Dos Santos P. C.; Lee H.-I.; Dean D. R.; Seefeldt L. C.; Hoffman B. M. Trapping H– Bound to the Nitrogenase FeMo-Cofactor Active Site during H2 Evolution: Characterization by ENDOR Spectroscopy. J. Am. Chem. Soc. 2005, 127, 6231–41. 10.1021/ja043596p. [DOI] [PubMed] [Google Scholar]
- Doan P. E.; Telser J.; Barney B. M.; Igarashi R. Y.; Dean D. R.; Seefeldt L. C.; Hoffman B. M. 57Fe ENDOR spectroscopy and ’Electron Inventory’ Analysis of the Nitrogenase E4 Intermediate Suggest the Metal-Ion Core of FeMo-Cofactor Cycles Through Only One Redox Couple. J. Am. Chem. Soc. 2011, 133, 17329–40. 10.1021/ja205304t. [DOI] [PMC free article] [PubMed] [Google Scholar]
- Christiansen J.; Goodwin P. J.; Lanzilotta W. N.; Seefeldt L. C.; Dean D. R. Catalytic and Biophysical Properties of a Nitrogenase Apo-MoFe Protein Produced by a nifB-Deletion Mutant of Azotobacter vinelandii†. Biochemistry 1998, 37, 12611–12623. 10.1021/bi981165b. [DOI] [PubMed] [Google Scholar]
- Solé V. A.; Papillon E.; Cotte M.; Walter P.; Susini J. A multiplatform code for the analysis of energy-dispersive X-ray fluorescence spectra. Spectrochim. Acta, Part B 2007, 62, 63–68. 10.1016/j.sab.2006.12.002. [DOI] [Google Scholar]
- Ravel B.; Newville M. ATHENA, ARTEMIS, HEPHAESTUS: data analysis for X-ray absorption spectroscopy using IFEFFIT. J. Synchrotron Radiat. 2005, 12, 537–41. 10.1107/S0909049505012719. [DOI] [PubMed] [Google Scholar]
- Cutsail G. E. 3rd; Banerjee R.; Zhou A.; Que L. Jr.; Lipscomb J. D.; DeBeer S. High-Resolution Extended X-ray Absorption Fine Structure Analysis Provides Evidence for a Longer Fe-Fe Distance in the Q Intermediate of Methane Monooxygenase. J. Am. Chem. Soc. 2018, 140, 16807–16820. 10.1021/jacs.8b10313. [DOI] [PMC free article] [PubMed] [Google Scholar]
- Castillo R. G.; Banerjee R.; Allpress C. J.; Rohde G. T.; Bill E.; Que L. Jr.; Lipscomb J. D.; DeBeer S. High-Energy-Resolution Fluorescence-Detected X-ray Absorption of the Q Intermediate of Soluble Methane Monooxygenase. J. Am. Chem. Soc. 2017, 139, 18024–18033. 10.1021/jacs.7b09560. [DOI] [PMC free article] [PubMed] [Google Scholar]
- Lukoyanov D.; Yang Z.-Y.; Duval S.; Danyal K.; Dean D. R.; Seefeldt L. C.; Hoffman B. M. A Confirmation of the Quench-Cryoannealing Relaxation Protocol for Identifying Reduction States of Freeze-Trapped Nitrogenase Intermediates. Inorg. Chem. 2014, 53, 3688–93. 10.1021/ic500013c. [DOI] [PMC free article] [PubMed] [Google Scholar]
- Tittsworth R. C.; Hales B. J. Detection of EPR Signals Assigned to the 1-equiv-Oxidized P-Clusters of the Nitrogenase MoFe-Protein from Azotobacter vinelandii. J. Am. Chem. Soc. 1993, 115, 9763–9767. 10.1021/ja00074a050. [DOI] [Google Scholar]
- Bjornsson R.; Lima F. A.; Spatzal T.; Weyhermüller T.; Glatzel P.; Bill E.; Einsle O.; Neese F.; DeBeer S. Identification of a spin-coupled Mo(III) in the nitrogenase iron-molybdenum cofactor. Chem. Sci. 2014, 5, 3096–3103. 10.1039/C4SC00337C. [DOI] [Google Scholar]
- Danyal K.; Dean D. R.; Hoffman B. M.; Seefeldt L. C. Electron Transfer within Nitrogenase: Evidence for a Deficit-Spending Mechanism. Biochemistry 2011, 50, 9255–63. 10.1021/bi201003a. [DOI] [PMC free article] [PubMed] [Google Scholar]
- Danyal K.; Mayweather D.; Dean D. R.; Seefeldt L. C.; Hoffman B. M. Conformational Gating of Electron Transfer from the Nitrogenase Fe Protein to MoFe Protein. J. Am. Chem. Soc. 2010, 132, 6894–5. 10.1021/ja101737f. [DOI] [PMC free article] [PubMed] [Google Scholar]
- Yang Z.-Y.; Ledbetter R.; Shaw S.; Pence N.; Tokmina-Lukaszewska M.; Eilers B.; Guo Q.; Pokhrel N.; Cash V. L.; Dean D. R.; Antony E.; Bothner B.; Peters J. W.; Seefeldt L. C. Evidence That the Pi Release Event Is the Rate-Limiting Step in the Nitrogenase Catalytic Cycle. Biochemistry 2016, 55, 3625–35. 10.1021/acs.biochem.6b00421. [DOI] [PubMed] [Google Scholar]
- Musgrave K. B.; Liu H. I.; Ma L.; Burgess B. K.; Watt G.; Hedman B.; Hodgson K. O. EXAFS studies on the PN and POX states of the P-clusters in nitrogenase. JBIC, J. Biol. Inorg. Chem. 1998, 3, 344–352. 10.1007/s007750050243. [DOI] [Google Scholar]
- Rees J. A.; Bjornsson R.; Kowalska J. K.; Lima F. A.; Schlesier J.; Sippel D.; Weyhermuller T.; Einsle O.; Kovacs J. A.; DeBeer S. Comparative electronic structures of nitrogenase FeMoco and FeVco. Dalton Trans. 2017, 46, 2445–2455. 10.1039/C7DT00128B. [DOI] [PMC free article] [PubMed] [Google Scholar]
- Eisenberger P.; Platzman P. M.; Winick H. X-Ray Resonant Raman Scattering: Observation of Characteristic Radiation Narrower than the Lifetime Width. Phys. Rev. Lett. 1976, 36, 623–626. 10.1103/PhysRevLett.36.623. [DOI] [Google Scholar]
- Glatzel P.; Sikora M.; Smolentsev G.; Fernández-García M. Hard X-ray photon-in photon-out spectroscopy. Catal. Today 2009, 145, 294–299. 10.1016/j.cattod.2008.10.049. [DOI] [Google Scholar]
- Lima F. A.; Bjornsson R.; Weyhermuller T.; Chandrasekaran P.; Glatzel P.; Neese F.; DeBeer S. High-resolution molybdenum K-edge X-ray absorption spectroscopy analyzed with time-dependent density functional theory. Phys. Chem. Chem. Phys. 2013, 15, 20911–20. 10.1039/c3cp53133c. [DOI] [PubMed] [Google Scholar]
- Glatzel P.; Bergmann U. High resolution 1s core hole X-ray spectroscopy in 3d transition metal complexes—electronic and structural information. Coord. Chem. Rev. 2005, 249, 65–95. 10.1016/j.ccr.2004.04.011. [DOI] [Google Scholar]
- Yoo S. J.; Angove H. C.; Burgess B. K.; Hendrich M. P.; Münck E. Mössbauer and Integer-Spin EPR Studies and Spin-Coupling Analysis of the [4Fe-4S]0 Cluster of the Fe Protein from Azotobacter vinelandii Nitrogenase. J. Am. Chem. Soc. 1999, 121, 2534–2545. 10.1021/ja9837405. [DOI] [Google Scholar]
- Christiansen J.; Tittsworth R. C.; Hales B. J.; Cramer S. P. Fe and Mo EXAFS of Azotobacter vinelandii Nitrogenase in Partially Oxidized and Singly Reduced Forms. J. Am. Chem. Soc. 1995, 117, 10017–10024. 10.1021/ja00145a012. [DOI] [Google Scholar]
- Hedman B.; Frank P.; Gheller S. F.; Roe A. L.; Newton W. E.; Hodgson K. O. New Structure Insights into the Iron-Molybdenum Cofactor from Azotobacter vinelandii Nitrogenase through Sulfur K and Molybdenum L X-ray Absorption Edge Studies. J. Am. Chem. Soc. 1988, 110, 3798–3805. 10.1021/ja00220a013. [DOI] [Google Scholar]
- Hoffman B. M.; Roberts J. E.; Orme-Johnson W. H. 95Mo and 1H ENDOR Spectroscopy of the Nitrogenase MoFe Protein. J. Am. Chem. Soc. 1982, 104, 860–862. 10.1021/ja00367a042. [DOI] [Google Scholar]
- True A. E.; McLean P.; Nelson M. J.; Orme-Johnson W. H.; Hoffman B. M. Comparison of Wild-Type and nifV Mutant Molybdenum-Iron Proteins of Nitrogenase from Klebsiella pneumoniae by ENDOR Spectroscopy. J. Am. Chem. Soc. 1990, 112, 651–657. 10.1021/ja00158a024. [DOI] [Google Scholar]
- Venters R. A.; Nelson M. J.; McLean P. A.; True A. E.; Levy M. A.; Hoffman B. M.; Orme-Johnson W. H. ENDOR of the Resting State of Nitrogenase Molybdenum-Iron Proteins from Azotobacter vinelandii, Klebsiella pneumoniae, and Clostridium pasteurianum: 1H, 57Fe, 95Mo, and 33S Studies. J. Am. Chem. Soc. 1986, 108, 3487–3498. 10.1021/ja00272a054. [DOI] [Google Scholar]
- Bjornsson R.; Delgado-Jaime M. U.; Lima F. A.; Sippel D.; Schlesier J.; Weyhermüller T.; Einsle O.; Neese F.; DeBeer S. Molybdenum L-Edge XAS Spectra of MoFe Nitrogenase. Z. Anorg. Allg. Chem. 2015, 641, 65–71. 10.1002/zaac.201400446. [DOI] [PMC free article] [PubMed] [Google Scholar]
- Conradson S. D.; Burgess B. K.; Newton W. E.; Hodgson K. O.; McDonald J. W.; Rubinson J. F.; Gheller S. F.; Mortenson L. E.; Adams M. W. W.; Mascharak P. K.; Armstrong W. A.; Holm R. H. Structural Insights from the Mo K-edge X-ray Absorption Near Edge Structure of the Iron-Molybdenum Protein of Nitrogenase and Its Iron-Molybdenum Cofactor by Comparison with Synthetic Fe-Mo-S Clusters. J. Am. Chem. Soc. 1985, 107, 7935–7940. 10.1021/ja00312a022. [DOI] [Google Scholar]
- Dance I. The pathway for serial proton supply to the active site of nitrogenase: enhanced density functional modeling of the Grotthuss mechanism. Dalton Trans. 2015, 44, 18167–86. 10.1039/C5DT03223G. [DOI] [PubMed] [Google Scholar]
- Siegbahn P. E. M. A Major Structural Change of the Homocitrate Ligand of Probable Importance for the Nitrogenase Mechanism. Inorg. Chem. 2018, 57, 1090–1095. 10.1021/acs.inorgchem.7b02493. [DOI] [PubMed] [Google Scholar]
- Chandrasekaran P.; Stieber S. C.; Collins T. J.; Que L. Jr.; Neese F.; DeBeer S. Prediction of high-valent iron K-edge absorption spectra by time-dependent Density Functional Theory. Dalton Trans. 2011, 40, 11070–9. 10.1039/c1dt11331c. [DOI] [PMC free article] [PubMed] [Google Scholar]
- DeBeer George S.; Brant P.; Solomon E. I. Metal and Ligand K-edge XAS of Organotitanium complexes: Metal 4p and 3d Contributions to Pre-edge Intensity and Their Contributions to Bonding. J. Am. Chem. Soc. 2005, 127, 667–74. 10.1021/ja044827v. [DOI] [PubMed] [Google Scholar]
- Westre T. E.; Kennepohl P.; DeWitt J. G.; Hedman B.; Hodgson K. O.; Solomon E. I. A Multiplet Analysis of Fe K-Edge 1s → 3d Pre-Edge Features of Iron Complexes. J. Am. Chem. Soc. 1997, 119, 6297–6314. 10.1021/ja964352a. [DOI] [Google Scholar]
- Kowalska J. K.; Hahn A. W.; Albers A.; Schiewer C. E.; Bjornsson R.; Lima F. A.; Meyer F.; DeBeer S. X-ray Absorption and Emission Spectroscopic Studies of [L2Fe2S2]n Model Complexes: Implications for the Experimental Evaluation of Redox States in Iron-Sulfur Clusters. Inorg. Chem. 2016, 55, 4485–97. 10.1021/acs.inorgchem.6b00295. [DOI] [PMC free article] [PubMed] [Google Scholar]
- Musgrave K. B.; Angove H. C.; Burgess B. K.; Hedman B.; Hodgson K. O. All-Ferrous Titanium(III) Citrate Reduced Fe Protein of Nitrogenase: An XAS Study of Electronic and Metrical Structure. J. Am. Chem. Soc. 1998, 120, 5325–5326. 10.1021/ja980598z. [DOI] [Google Scholar]
- Lugo-Mas P.; Dey A.; Xu L.; Davin S. D.; Benedict J.; Kaminsky W.; Hodgson K. O.; Hedman B.; Solomon E. I.; Kovacs J. A. How Does Single Oxygen Atom Addition Affect the Properties of an Fe-Nitrile Hydratase Analogue? The Compensatory Role of the Unmodified Thiolate. J. Am. Chem. Soc. 2006, 128, 11211–21. 10.1021/ja062706k. [DOI] [PMC free article] [PubMed] [Google Scholar]
- Robin M. B.; Day P. Mixed Valence Chemistry - A Survey and Classification. Adv. Inorg. Chem. Radiochem. 1968, 10, 247–422. 10.1016/S0065-2792(08)60179-X. [DOI] [Google Scholar]
Associated Data
This section collects any data citations, data availability statements, or supplementary materials included in this article.