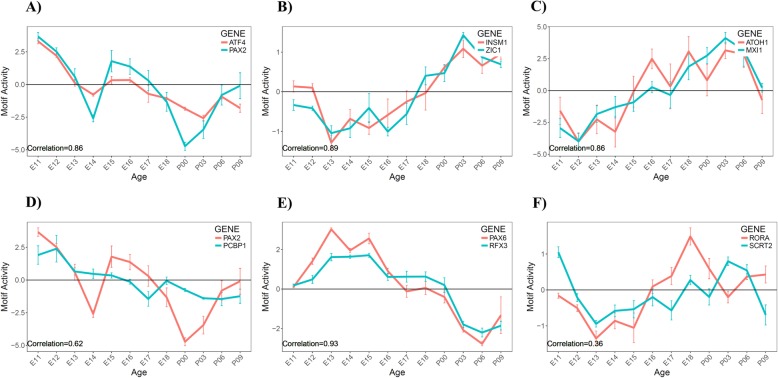
Fig. 4.
Identification of validation candidates with similar motif activity patterns to known cerebellar regulators. The motif activity (y-axis) is measured at different time points of the time series (x-axis). A positive activity indicates an overall activation of downstream targets sharing the motif; and a negative activity indicates an overall suppression of downstream targets; a motif activity of 0 indicates no change in expression between the two consecutive time points. Motif activities of known and novel TFs are shown with blue and red plots, respectively. a. interneuron regulator Pax2 vs. novel TF Atf4. b. The granule cell regulator Zic1 vs. novel TF Insm1. c. The granule cell regulator Atoh1 vs. novel TF Mxi1. d. The interneuron regulator Pax2 vs. novel TF Pcbp1. e. The granule cell regulator Pax6 vs. novel TF Rfx3. f. The Purkinje cell regulator Rora (var. 2) vs. novel TF Scrt2

