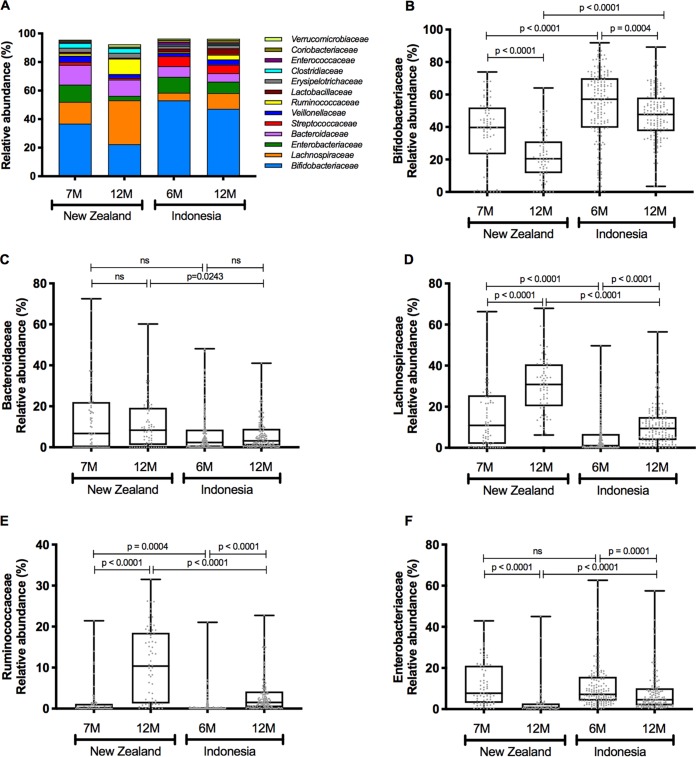
FIG 2.
Relative abundances of the 13 predominant families, with samples grouped according to cohort and time (A), and box plots (Tukey method; boxes are from the 25th percentile to the 75th percentile with a line at the median, whiskers are 1.5 times the interquartile range, and outliers are shown as points) showing the relative abundances of Bifidobacteriaceae (B), Bacteroidaceae (C), Lachnospiraceae (D), Ruminococcaceae (E), and Enterobacteriaceae (F) in each cohort. Groups were compared using Mann-Whitney nonparametric tests. ns, not significant.

