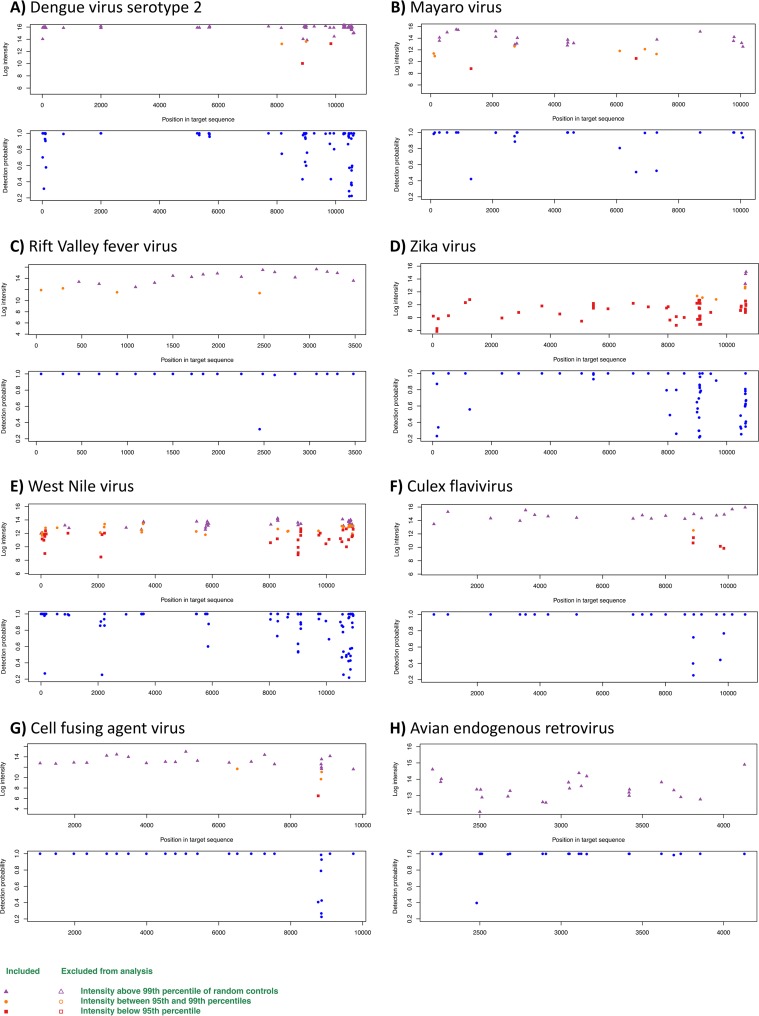
FIG 1.
LLMDA probe detection for DENV-2 (A), MAYV (B), RVFV (C), ZIKV (D), WNV (E), CxFLAV (F), CFAV (G), and avian endogenous retrovirus (H). For each virus, two graphs are shown; the upper panel represents the intensity of the probes according to the position of the target in the genome; the lower panel represents the probability of detection according to the genome region. Samples for which intensity was higher than the 99th percentile of that of the control probes are shown in purple, those for which intensity is between the 99th and 95th percentiles are shown in orange, and those for which the intensity was below the 95th percentile are in red.

