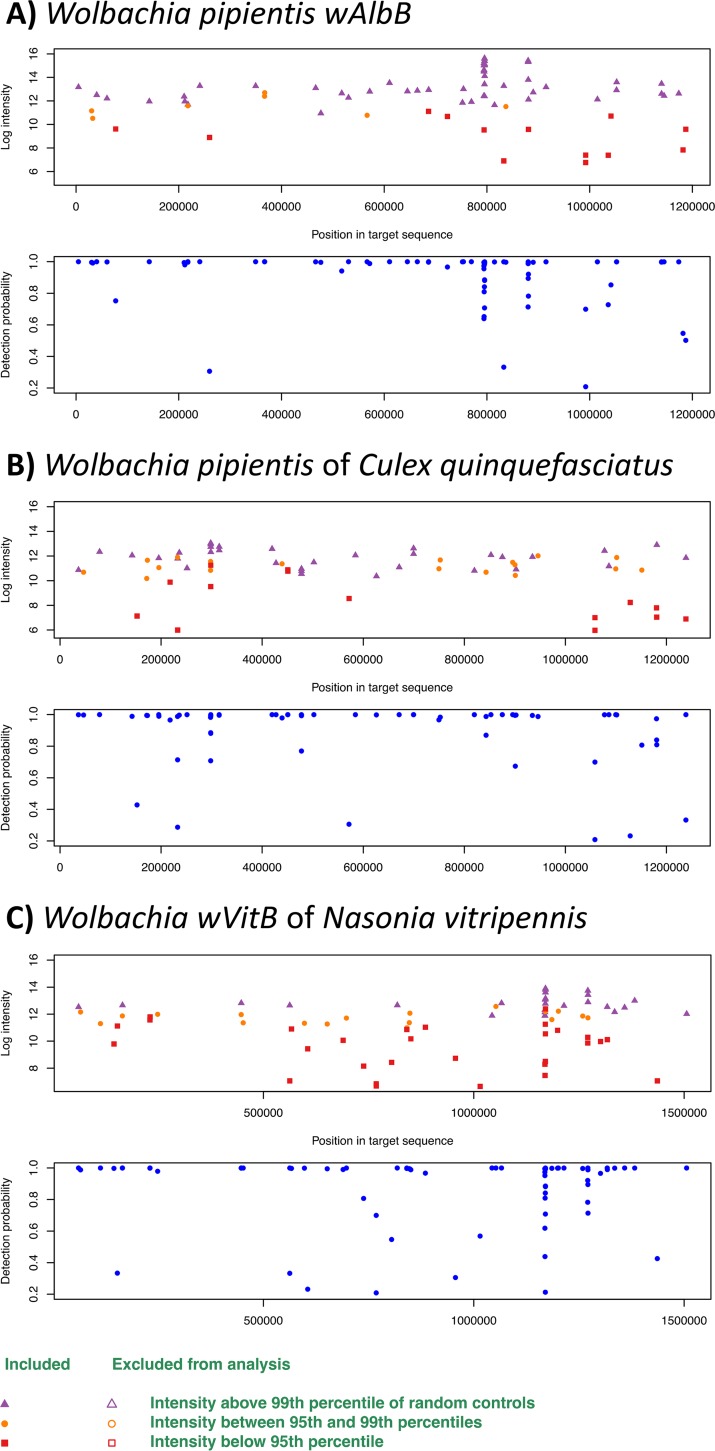
FIG 2.
LLMDA probe detection of Wolbachia strains. (A) Wolbachia pipientis wAlbB; (B) Wolbachia endosymbiont of Culex quinquefasciatus; (C) Wolbachia endosymbiont wVitB. For each bacterium, the upper panel represents the intensity of the probes according to the position of the target in the genome (>99th percentile of control in purple, 95th to 99th, in orange, and <95th in red). The lower panel represents the probability of detection according to the genome region.

