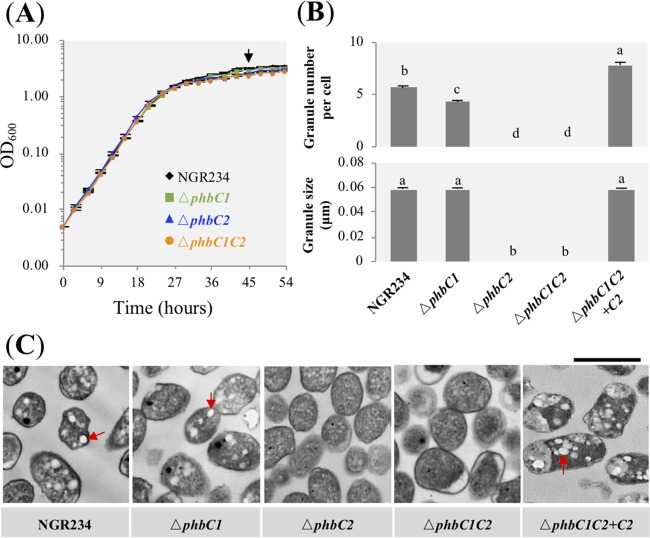
FIG 1.
Characteristics of PHB granules in free-living NGR234 and mutants lacking PHB synthase. (A) Growth curves of test strains. Bacterial cells were collected at stationary phase, as indicated by an arrow. (B) Number and size of PHB granules. A total of 150 cells were scored for each strain. Values represent means ± SEMs. Different letters indicate significant difference (alpha = 0.05, Duncan’s test). (C) Transmission electronic microscopy pictures. Red arrows indicate PHB granules. Bar, 1 μm.

