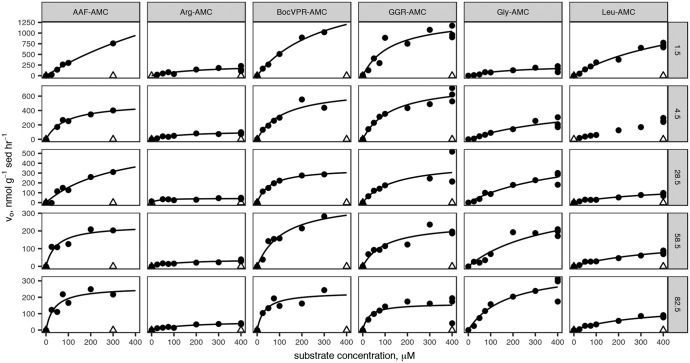
FIG 1.
Saturation curves for six substrates measured using the single-cuvette reader methodology at each of six depths. Dark circles indicate “live” samples; open triangles indicate autoclaved controls. Lines indicate nonlinear least-squares fits to the Michaelis-Menten rate law. Substrate abbreviations are given in the column headings and are defined in Table 1. Sediment depths are listed on row headings in centimeters below sediment-water interface.

