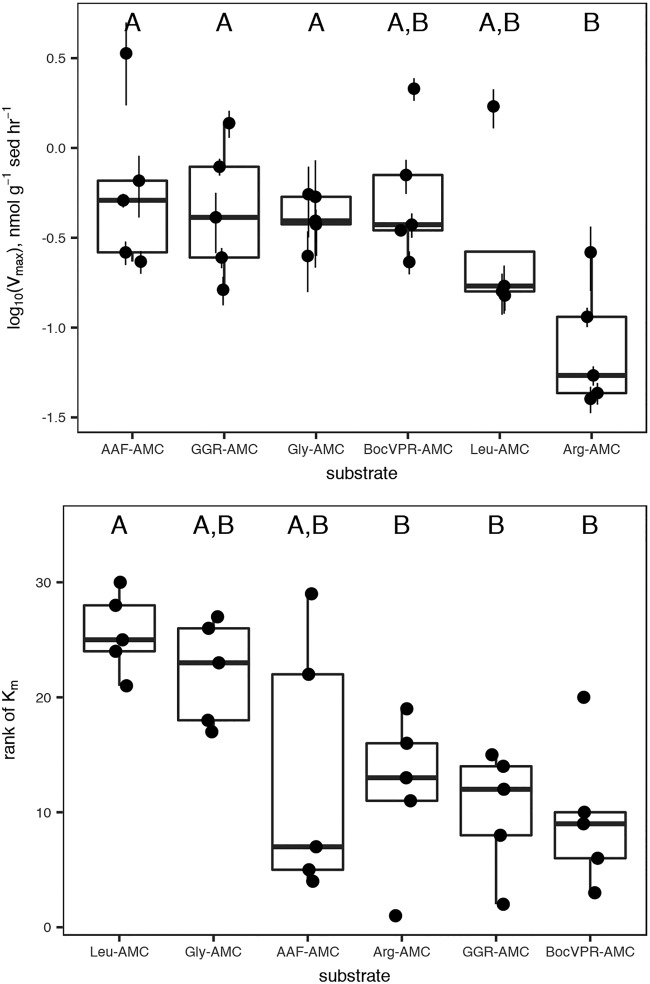
FIG 2.
Vmax and Km values, shown individually with error bars indicating SEs of the nonlinear least-squares estimates, and collectively in a box-and-whisker plot. Substrates sharing a letter are not significantly different according to one-way analysis of variance (ANOVA) of log10-transformed data with Tukey honestly significant difference (HSD) post hoc analysis (Vmax) or Kruskal-Wallis test with Tukey HSD post hoc analysis (Km).

