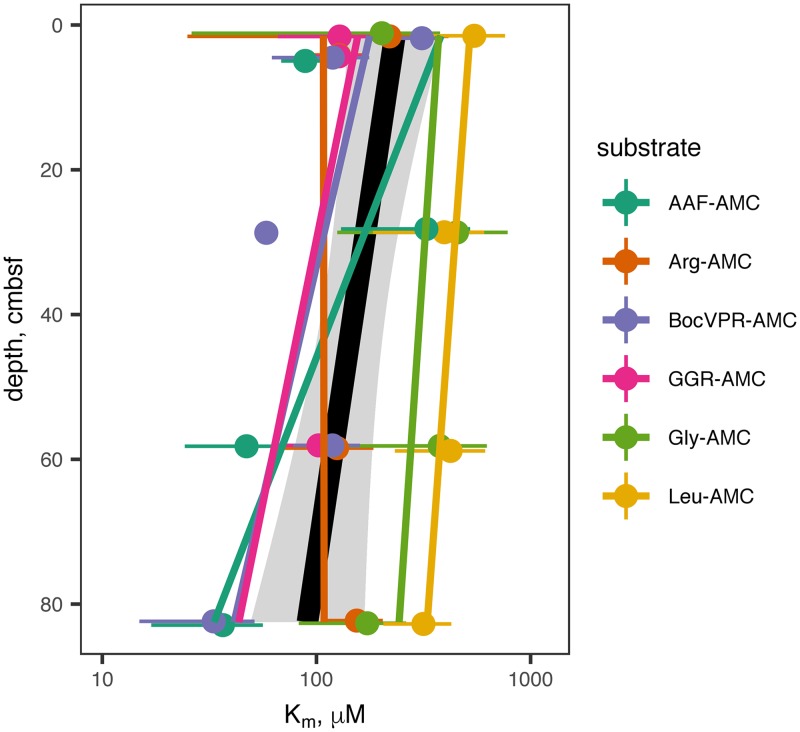
FIG 3.
Km values of extracellular peptidases as a function of depth. Details of substrates and the peptidases they correspond to are in Table 1. Error bars represent the SDs of replicate samples. Colored lines represent a linear least-squares regression for each substrate. The black line and gray shading represent linear regression and 95% confidence interval for all substrates taken together.

