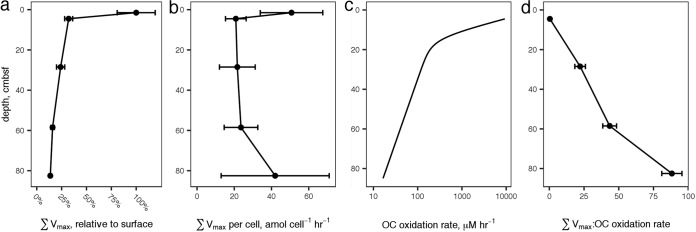
FIG 5.
(a) The sum of all peptidase Vmax values, relative to the value at 4.5 cm, versus sediment depth. Error bars represent propagated errors of the Vmax estimates for the substrates. (b) Summed Vmax relative to cell count. Error bars represent propagated errors from summed Vmaxs and cell counts; errors are dominated by cell count uncertainty. (c) Organic carbon oxidation rates modeled from sulfate and methane profiles. (d) Summed Vmaxs relative to modeled carbon oxidation rates. Error bars represent propagated error from summed Vmaxs and cell counts. The propagated error is dominated by uncertainty in the cell counts.

