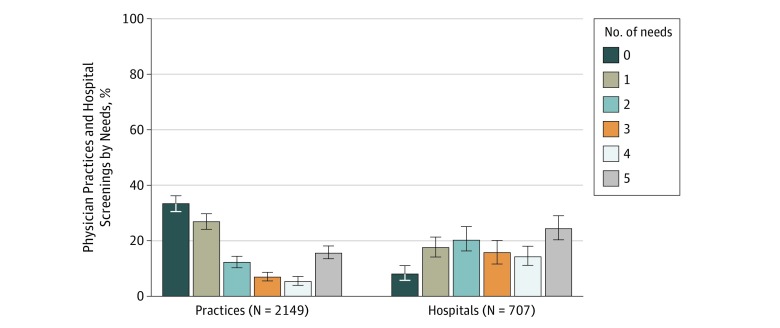
Figure 2. Percentage of Physician Practices and Hospitals That Screen Patients for Food Insecurity, Housing Instability, Utility Needs, Transportation Needs, and Experience With Interpersonal Violence, by Number of Needs Screened .
Number of survey respondents from the 2017-2018 National Survey of Healthcare Organizations and Systems are unweighted. Percentages represent weighted data; error bars, 95% CIs.

