
Figure 2.
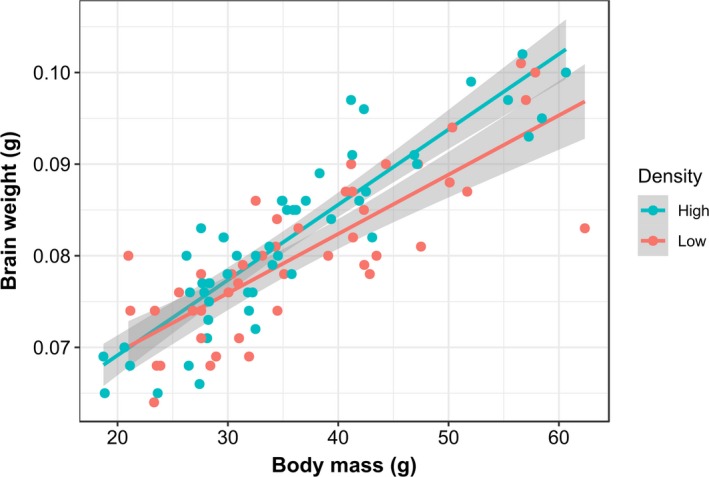
Relationship between body weight and brain weight in Nile tilapia reared at low and high density (density effect t 94 = −2.54, p = 0.013)
Official websites use .gov
A
.gov website belongs to an official
government organization in the United States.
Secure .gov websites use HTTPS
A lock (
) or https:// means you've safely
connected to the .gov website. Share sensitive
information only on official, secure websites.
Relationship between body weight and brain weight in Nile tilapia reared at low and high density (density effect t 94 = −2.54, p = 0.013)