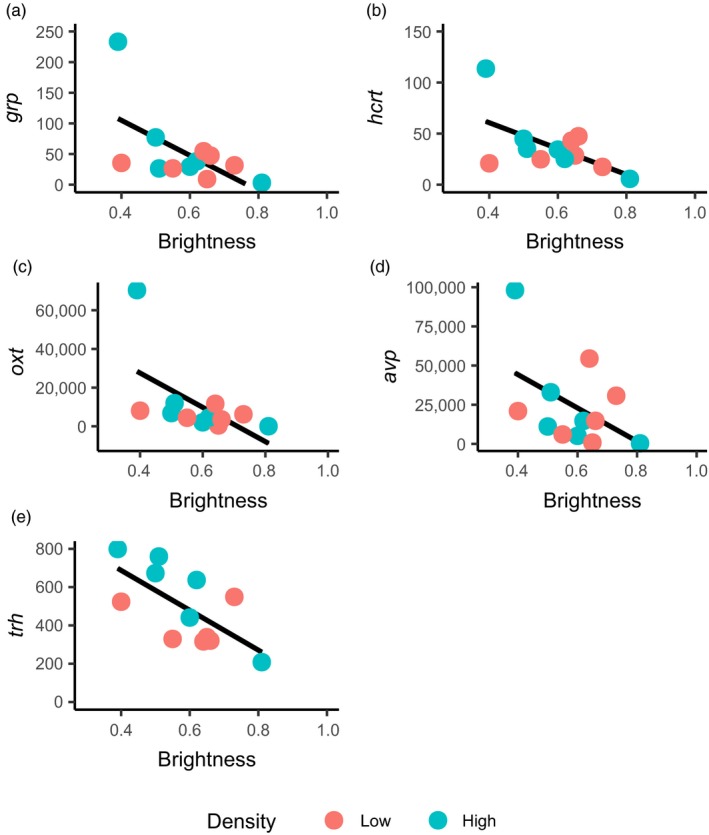
Figure 5.

Relationship between skin brightness (a proxy for stress) and gene expression (DESeq2 normalized counts) in the six least aggressive fish at each density. Shown are examples of five responsive genes (out of 38) where there was a significant negative relationship between skin brightness and gene expression (q < 0.05; Table 1) independently of rearing density, suggesting a common stress response: (a) grp, (b) hcrt, (c) oxytocin (oxt), (d) arginine vasopressin (avp) and (e) thyrotropin‐releasing hormone (trh)
