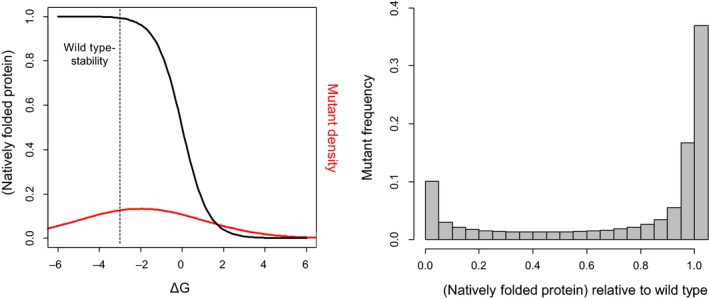
Figure 3.

Illustration of the thermodynamic hypothesis for DMEs in proteins. Left panel—Black sigmoid curve shows the fraction of natively folded protein molecules as a function of the free energy of folding, ΔG, following: , where kb is the Boltzmann constant and T is temperature (kbT is set here to 0.62, as in (Wylie & Shakhnovich, 2011)). Dashed line marks a hypothetical wild‐type protein stability (−3 kcal/mole), located on the plateau of the sigmoid, for illustration. Red curve shows a hypothetical distribution of mutant ΔG values, resulting from a DME on ΔG that is Gaussian with a mean of +1, following (Wylie & Shakhnovich, 2011), but here with a larger standard deviation of 3. The stability sigmoid could be steepened by effects such as irreversible aggregation or degradation of misfolded species (Tokuriki & Tawfik, 2009). Right panel: The resulting DME on the relative fraction of natively folded protein molecules, which is bimodal under these parameter values
