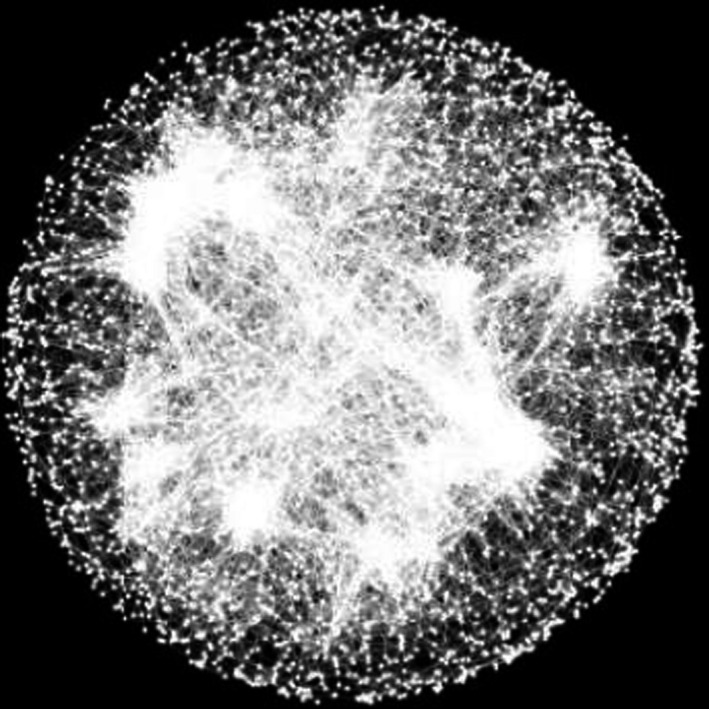
Figure 10.

A genome‐wide network of gene–gene interaction profile similarities. Nodes are yeast genes, and edges connect genes with similar genome‐wide fitness interaction profiles, revealing functional modules. [From Science, 353(6,306), aaf1420‐2, A global genetic interaction network maps a wiring diagram of cellular function (Costanzo et al., 2016). Reprinted with permission from AAAS]
