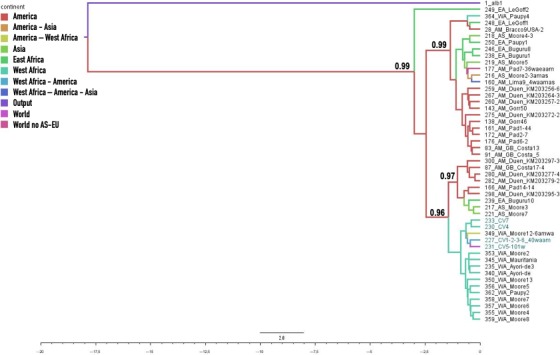
Figure 2.

Bayesian phylogenetic tree (see text for details) of relationships among 49 haplotypes of Aedes aegypti based on a 360‐bp ND4 fragment and using A. albopictus as outgroup (in the Figure, it is written “output” by mistake). The support values written on the branches correspond to posterior probabilities (values < 0.900 are not presented). The haplotype codes and their origins are listed in Appendix S1c. The branch lines are colored by geographic distribution of the corresponding haplotypes. Time scale: substitutions/Myr
