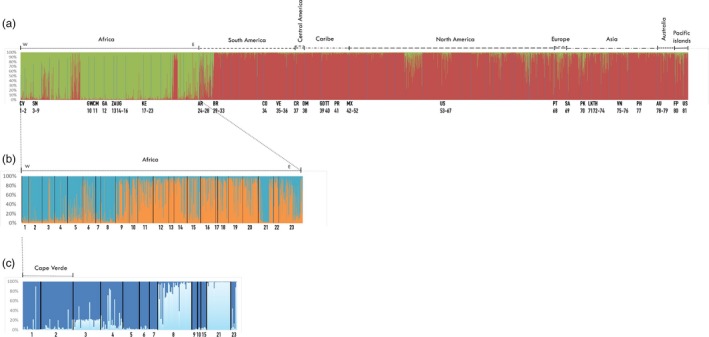
Figure 4.

Global genetic structure of Aedes aegypti. STRUCTURE bar plots indicating genetic groupings of different geographic locations based on nine microsatellite loci. Each vertical bar represents an individual. The height of each bar represents the probability of assignment (Q) to each of K = N clusters as determined using the Delta K method. Each cluster is indicated by different colors. (a) Genetic groupings of 81 geographic locations and 3,703 individuals, sorted by countries, best K = 2 clusters, A. a. aegypti: red and A. a. formosus: green. Population code numbers are as follows: 1‐Santiago 2010, CV; 2‐Santiago 2007, CV; 3‐Dakar, SN; 4‐N'goye, SN; 5‐Sedhiou, SN; 6‐Koungheul, SN; 7‐Ngari, SN; 8‐Goudiry, SN; 9‐PK‐10, SN; 10‐Bijagos, GW; 11‐Yaounde, CM; 12‐Francesville, GA; 13‐Johannesburg, ZA; 14‐Kichwamba, UG; 15‐Bundibugyo, UG; 16‐Lunyo, UG; 17‐Kakamenga, KE; 18‐Kisimu, KE; 19‐Nairobi, KE; 20‐Rabai‐out, KE; 21‐Rabai‐in, KE; 22‐Garissa, KE; 23‐Mombasa, KE; 24‐Cordoba, AR; 25‐Salta, AR; 26‐Iguazu, AR; 27‐La Plata, AR; 28‐Posadas, AR; 29‐Cachoeiro, BR; 30‐Maraba, BR; 31‐Natal, BR; 32‐Jacobina, BR; 33‐Rio de Janeiro, BR; 34‐Cali, CO; 35‐Bolivar, VE; 36‐Zulia, VE; 37‐Siquirres, CR; 38‐Dominica, DM; 39‐Carriacou, GD; 40‐Trinidad, TT; 41‐Patillas, PR; 42‐Tijuana, MX; 43‐Pijijiapan, MX; 44‐Las Palomas, MX; 45‐Lomas de Zapatero, MX; 46‐Iguala, MX; 47‐Mazatan, MX; 48‐Tapachula Norte, MX; 49‐Hermosillo, MX; 50‐Nogales, MX; 51‐Chetumal, MX; 52‐Amacuzac, MX; 53‐Maricopa, USA; 54‐Madera, USA; 55‐Clovis, USA; 56‐New Orleans, USA; 57‐Houston, USA; 58‐Vaca Key, USA; 59‐Miami, USA; 60‐Musco, USA; 61‐San Mateo, USA; 62‐Rio FL, USA; 63‐Exeter, USA; 64‐Los Angeles, USA; 65‐Conch Key, USA; 66‐Palm Beach, USA; 67‐North Key West, USA; 68‐Madeira, PT; 69‐Riyadh, SA; 70‐Pakistan, PK; 71‐Sri Lanka, LK; 72‐Rayong, TH; 73‐Prachuabkhirikan, TH; 74‐Bangkok, TH; 75‐Ho Chi Minh, VN; 76‐Hanoi, VN; 77‐Cebu, PH; 78‐Townsville, AU; 79‐Cairns, AU; 80‐Tahiti, FP; 81‐Hawaii, USA. All details about the non‐Cape Verdean samples are described elsewhere (Gloria‐Soria et al., 2016). (b) Genetic groupings of 23 African populations and 989 individuals from a), sorted by countries and by longitude (W: west to E: east), best K = 2 clusters (blue and orange). (c) The same 989 individuals from 23 African populations as in b), sorted by Q. (d) Genetic groupings of 13 African populations and 258 individuals selected from individuals with the Q > 0.90 of assignment to the blue cluster in a), best K = 2
