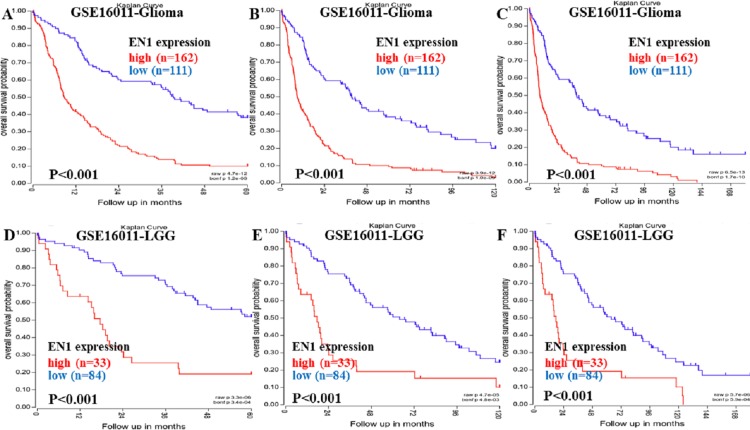
Figure 2. Kaplan–Meier curves of OS in glioma and LGG patients with high or low EN1 expression in GSE16011.
(A–C) Kaplan-Meier curves of 5-year OS (A), 10-year OS (B) and 15-year OS (C) in the glioma patients with high or low EN1 expression in GSE16011. (D–F) Kaplan-Meier curves of 5-year OS (D), 10-year OS (E) and 15-year OS (F) in the LGG patients with high or low EN1 expression in GSE16011. OS curves were generated by using auto-select best cutoff. High or low EN1 expression are showed in red or blue color respectively. Analysis was performed using R2.

