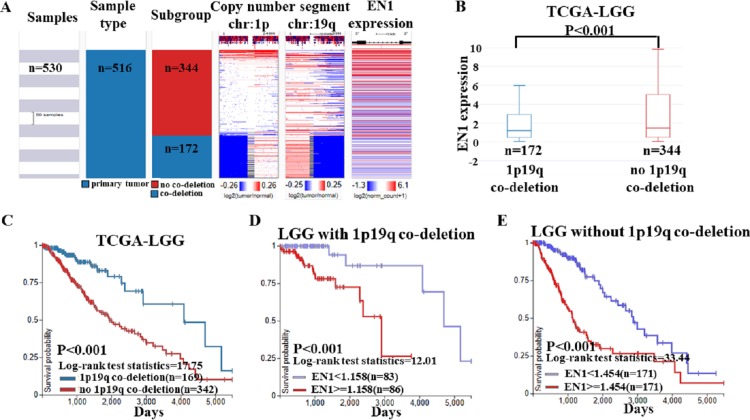
Figure 6. EN1 expression in LGG patients with or without 1p19q co-deletion in TCGA-LGG.
(A) The heat map of EN1 expression in genomic subclassifications of LGG, including patient samples, 1p19q DNA copy number status and EN1 mRNA expression level. (B) The corresponding box plots of EN1 expression profile in LGG patients with or without 1p19q co-deletion based on TCGA-LGG. (C) Kaplan-Meier curves of 15-year OS in the subtypes of LGG with or without 1p19q co-deletion. (D) Kaplan-Meier curves of 15-year OS in patients with high or low EN1 expression in 1p19q co-deletion group. (E) Kaplan-Meier curves of 15-year OS in patients with high or low EN1 expression in no 1p19q co-deletion group. OS curves were generated by setting median EN1 expression as cutoff. High or low EN1 expression are showed in red or blue color, respectively. Analysis was performed using the UCSC Xena browser.

