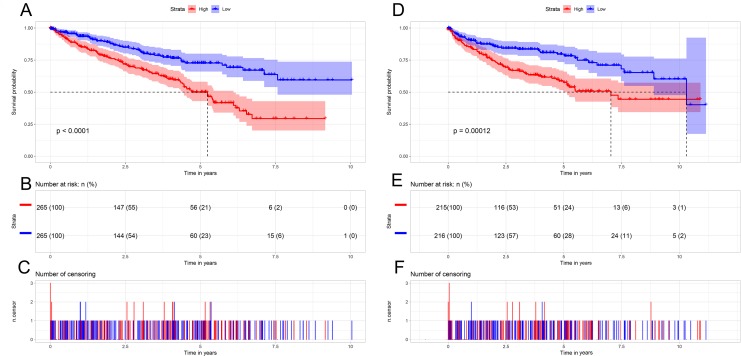
Figure 3. Kaplan-Meier survival curves of patients with ccRCC based on AURKB expression levels.
(A) The Kaplan-Meier curves, (B) number at risk, and (C) number of censoring of OS in ccRCC. (D) The Kaplan-Meier curves, (E) number at risk, and (F) number of censoring of DFS in ccRCC. High expression of AURKB was correlated with poorer OS and DFS in ccRCC patients.

