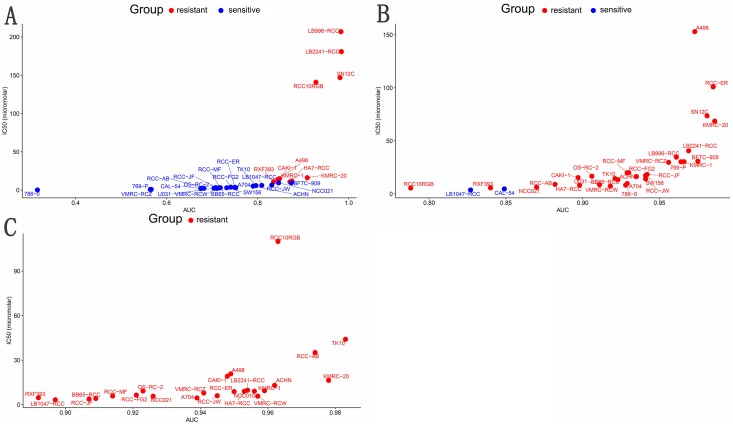
Figure 6. Drugs sensitivity analysis of ccRCC cell ines.
(A) Genentech Cpd 10, (B) Cabozantinib, (C) Axitinib. Those cell lines whose IC50 value greater than max screening concentration was regarded as resistant to target drugs. Blue represents sensitive ccRCC cell lines to target drugs; red indicates resistant ccRCC cell lines to target drugs; IC50, natural log half maximal inhibitory concentration; AUC, Area under the dose-response curve.

