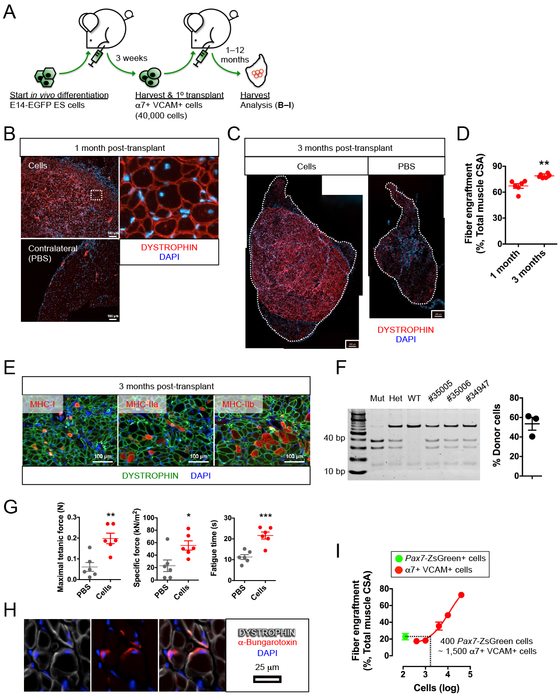
Figure 2. ES cell-derived myogenic progenitors reconstitute functional fibers.
(A) Schematic of functional evaluation of E14-EGFP ES cell-derived α7+ VCAM+ myogenic progenitors.
(B–F) ES cell-derived α7+ VCAM+ myogenic progenitors engrafted and differentiated into functional muscle fibers.
(B) α7+ VCAM+ myogenic progenitors engrafted and differentiated into DYSTROPHIN+ muscle fibers (top left) (n=18 biological replicates). Areas depicted by the white dotted rectangle are magnified to show individual fibers (top right). Minimal DYSTROPHIN+ revertant fibers were observed in the contralateral muscle with PBS injection (bottom left). Scale bar represents 100 μm.
(C) Engraftment (DYSTROPHIN+ fibers) at 3 months comparing injected (left) to contralateral PBS-injected (right) (n=6 biological replicates). The whole TA is outlined. Scale bar represents 200 μm.
(D) Quantitation of fiber engraftment (DYSTROPHIN+ fibers) at 1 month and 3 months (n=6 biological replicates). **p<0.01 versus 1 month.
(E) Engrafted DYSTROPHIN+ muscle fibers consist of slow (MHC-I) and fast (MHC-IIa, MHC-IIb) twitch fibers (n=6 biological replicates). Scale bar represents 100 μm.
(F) Contribution of donor nuclei in transplanted muscle. SCID PCR of total genomic DNA from transplanted muscles (left) and quantification (right). The first 3 control lanes represent: Mut, PrkdcSCID/SCID; Het, Prkdc+/SCID; WT: Prkdc+/+. The 3 right lanes represent transplanted muscles.
(G) Ex vivo physiological assessment revealed functional improvement at 3 months after α7+ VCAM+ cells transplantation (n=6 biological replicates). *p<0.05, **p<0.01, ***p<0.001 versus PBS (vehicle).
(H) Cross section showing pre-synaptic staining with α-bungarotoxin in DYSTROPHIN+ fibers (n=3 biological replicates). Scale bar represents 25 μm.
(I) Comparison of Pax7-ZsGreen satellite cells and α7+ VCAM+ teratoma cells: 400 Pax7-ZsGreen cells are equivalent to 1,500 α7+ VCAM+ cells for fiber engraftment (n=4–5 biological replicates). Note that the raw data for generating the dose-response relationship is shown in Figure S2F.
α7, α7-integrin. VCAM, VCAM-1. CSA, cross-sectional area. ES cells, embryonic stem cells. Lin, lineage cocktail comprising antibodies against CD45 (hematopoietic) and CD31 (endothelial). MHC, myosin heavy chain. Mean ± SEM is shown in (D), (F), (G) and (I). See also Figure S2.

