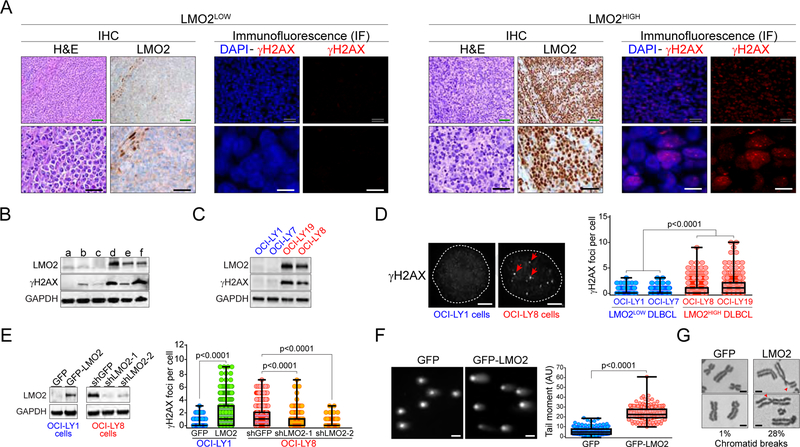
Figure 1. Expression of LMO2 protein induces the accumulation of DSBs in DLBCL.
(A) Representative immunohistochemistry (IHC) and immunofluorescence (IF) micrographs showing LMO2 and γH2AX expression, respectively, in untreated patient-derived LMO2LOW or LMO2HIGH DLBCL samples. Green scale bars represent 100 μm, black scale bars 50 μm, and white scale bars 10 μm.
(B) Western blots showing LMO2 and γH2AX levels in untreated patient-derived DLBCL samples.
(C) As in (B), for the indicated DLBCL cell lines.
(D) Representative IF micrographs showing γH2AX foci in DLBCL cell lines with and without LMO2 expression (left) and quantification of γH2AX foci per cell in the indicated DLBCL cell lines (right). Example of γH2AX foci are indicated with red arrows. White scale bars represent 1 μm. At least 500 cells analyzed per cell line/experiment in IF experiments. p values from Student’s t tests. Box plots show all points, median and the lower and upper quantile (box). Data obtained from 3 independent experiments.
(E) LMO2 protein levels determined via Western blots (left) and quantification of γH2AX foci per cell (right) in the indicated DLBCL cell lines expressing GFP, GFP-LMO2, shGFP or shLMO2. At least 500 cells analyzed per cell line/experiment. Box plots show all points, median and the lower and upper quantile (box). Data obtained from 3 independent experiments. p values from Student’s t tests.
(F) Representative micrographs showing SYBR Green signal in neutral comet assays for OCI-LY1 expressing indicated proteins (left) and quantification of tail-moment in comet assays (right). White scale bars represent 10 μm. Box plots show all points, median and the lower and upper quantile (box). Data obtained from 3 independent experiments. p value from Student’s t test.
(G) Metaphase spreads showing chromatid breaks in OCI-LY1 cells expressing either GFP or GFP-LMO2 proteins. The percentage of metaphases showing more than one chromatid break in each cell line is shown below the micrographs. p values from Student’s t tests. Data obtained from 3 independent experiments. Scale bars, 1 μm.

