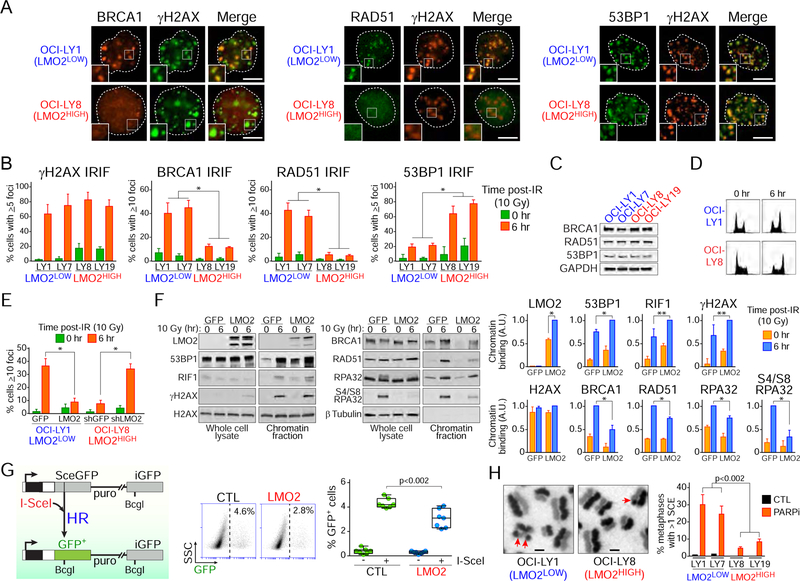
Figure 2. High expression levels of LMO2 protein inhibits BRCA1 and RAD51 damage foci after DNA damage.
(A) Representative immunofluorescence (IF) micrographs showing γH2AX, BRCA1, RAD51 and 53BP1 IRIF in the indicated DLBCL cell lines at 6 hr after ionizing radiation (10 Gy). Insets zoom factor 2X. Scale bar, 5 μm.
(B) Quantification of IRIF in the indicated cell lines 6 hr post-exposure to 10 Gy. *, p<0.001 Student’s t tests. At least 50 cells analyzed per cell line/experiment in IF experiments. Bars represent SD obtained from 3 independent experiments.
(C) Western blot assays for the indicated proteins in DLBCL cells.
(D) Cell cycle analysis via propidium iodide staining before and 6 hr after ionizing radiation (10 Gy).
(E) Quantification of RAD51 IRIF in OCI-LY1 cells expressing GFP or GFP-LMO2 protein and OCI-LY8 cells expressing shGFP or shLMO2. *, p<0.001 Student’s t test. At least 50 cells analyzed per cell line/experiment in IF experiments. Bars represent SD obtained from 3 independent experiments.
(F) Western blots with total or chromatin-enriched extracts from OCI-LY1 cells expressing GFP or GFP-LMO2 protein at 0 and 6 hr post-IR (10 Gy) using the indicated antibodies (left) and quantification of Western blot signal intensities in chromatin-enriched fractions (right). A.U., arbitrary units. SD obtained from 3 independent experiments.
(G) Schematic representation of the structure of the HR reporter substrate DR-GFP and the HR product expressing a functional GFP (left), representative FACS results (middle), and frequency of HR activity (right). The relative HR activity of HEK293T cells expressing LMO2 (LMO2) to that in HEK293T control cells is measured with the DR-GFP reporter after I-SceI transfection. Box plots show all cells, median and the lower and upper quantile (box). Data obtained from 3 independent experiments. p value from Student’s t test.
(H) DLBCL cells grown for 32 hr in the presence of BrdU and 10 nM olaparib (PARPi) were arrested with colcemid, fixed and metaphases processed to visualize individual sister chromatids. SCEs in metaphase chromosomes are indicated with red arrows. The bar graph shows the mean+SD SCEs in the indicated cells obtained from 3 independent experiments. Scale bars, 2 μm. p value from Student’s t tests. At least 50 metaphases analyzed per cell line/experiment.
See also Figure S1.

