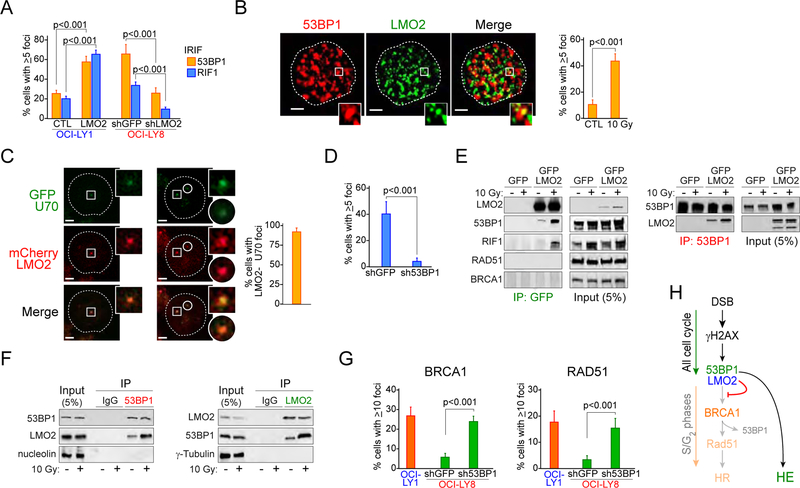
Figure 3. LMO2 forms a complex with 53BP1 during DNA damage HR.
(A) Quantification of 53BP1 and RIF1 ionizing radiation (IR)-induced foci (IRIF) in OCI-LY1 cells expressing GFP or GFP-LMO2 protein and OCI-LY8 cells expressing shGFP or shLMO2 4 hr post-exposure to 10 Gy. p values from Student’s t test are shown. At least 50 cells analyzed per cell line/experiment in IF experiments. Bars represent SD obtained from 3 independent experiments.
(B) Representative 3D confocal microscopy projections in OCI-LY8 cells showing co-localization of LMO2 and 53BP1 in IRIF (left) and quantification of LMO2 and 53BP1 foci colocalization in OCI-LY8 cells before and 4 hr post-exposure to 10 Gy (right). Inset zoom factor 3X. Scale bar, 1 μm. Bars represent SD obtained from 3 independent experiments.
(C) Representative fluorescence micrographs (left) and quantification (right) of LMO2 and KU70 co-localization in LMO2LOW U2932 cells transfected with plasmids encoding mCherry-LMO2 and GFP-KU70 after micro-irradiation with 405 nm laser (5 min). Inset zoom factor 3X. Scale bar, 1 μm. Error bars represent SD obtained from 3 independent experiments.
(D) LMO2 and γH2AX foci per cell in OCI-LY8 cells expressing shGFP or sh53BP1 4 hr post-exposure to 10 Gy. p value from Student’s t tests. Error bars represent SD obtained from 3 independent experiments. At least 50 cells analyzed per cell line/experiment in IF experiments.
(E) Immunoprecipitation (IP) assays with anti-GFP or anti-53BP1 antibodies and DNAseI-treated total extracts from OCI-LY1 cells expressing GFP or GFP-LMO2 fusion protein exposed or not to IR (10 Gy) for 4 hr.
(F) Immunoprecipitation (IP) assays with anti-LMO2 or anti-53BP1 antibodies and DNAseI-treated (nuclear for 53BP1 IP, total for LMO2 IP) extracts from OCI-LY19 cells expressing endogenous LMO2 exposed or not to IR (10 Gy) for 4 hr.
(G) Levels of BRCA1 and RAD51 IRIF in the indicated cells 6 hr post-10Gy. Error bars represent SD obtained from 3 independent experiments.
(H) Proposed model for LMO2-dependent inhibition of HR.
See also Figure S2.

