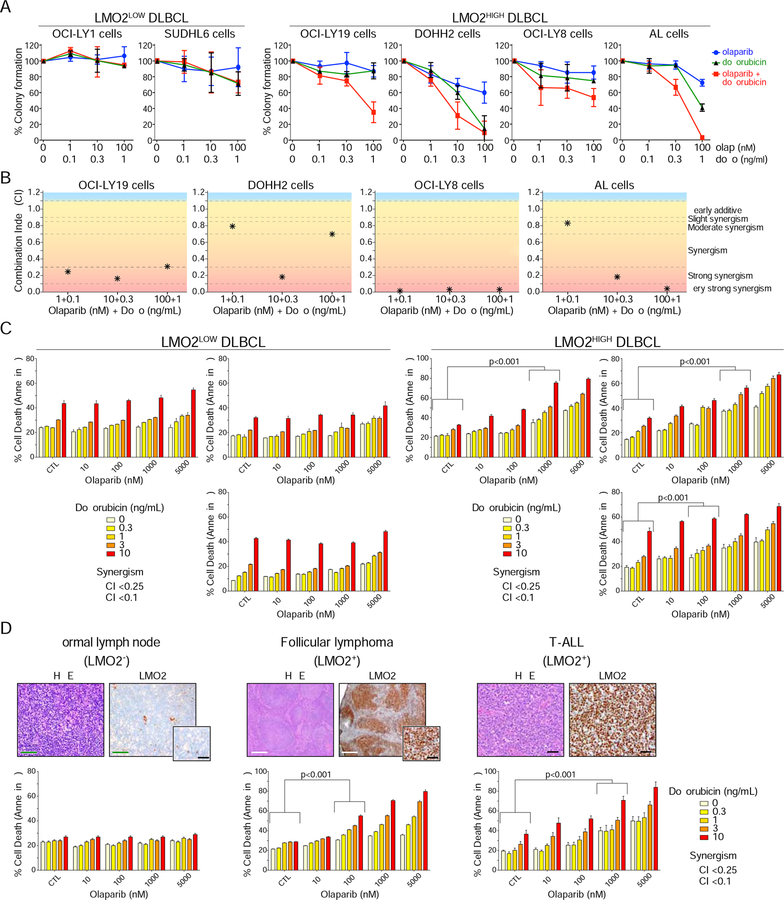
Figure 5. PARPi and doxorubicin show synergy in killing tumor cells expressing LMO2.
(A) Colony formation assays evaluating proliferation of DLBCL cell lines exposed for 2 days to increasing concentrations of olaparib and doxorubicin, as indicated. Error bars represent SD obtained from 3 independent experiments.
(B) Graphics showing the combination indexes (CI) calculated from colony formation assays shown in (A).
(C) Quantification of FACS results for annexin V staining of primary patient-derived DLBCL cells exposed for 4 days to increasing concentrations of olaparib and doxorubicin, as indicated. Combination index (CI) lower than 0.25 (*) or 0.1 (#) are shown. Error bars represent SD obtained from 3 independent experiments. p values from two-way ANOVA.
(D) IHC showing LMO2 protein expression in patient-derived samples (top) and quantification of FACS results for annexin V staining of tumor cells exposed for 4 days to increasing concentrations of olaparib and doxorubicin as indicated (bottom). Combination index (CI) lower than 0.25 (*) or 0.1 (#) are shown. Error bars represent SD obtained from 3 independent experiments. p values from two-way ANOVA. Green scale bars, 100 μm. White scale bars, 400 μm. Black scale bars 40 μm.

