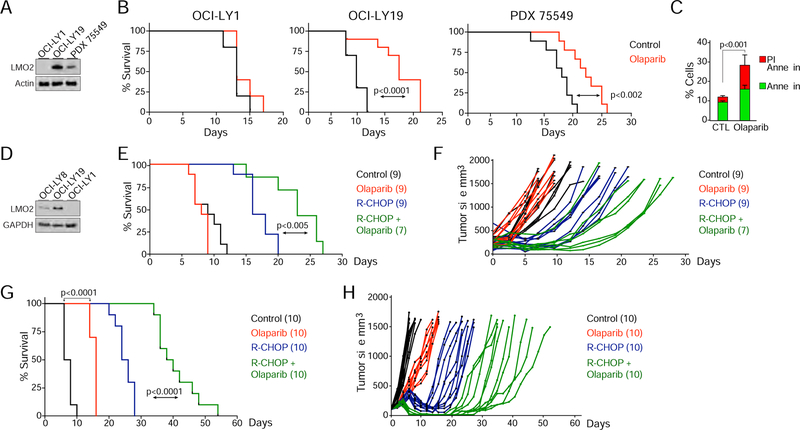
Figure 6. Olaparib alone or in combination with R-CHOP slows tumor growth and prolongs survival of mice with LMO2HIGH DLBCL xenografts.
(A) Western blots for LMO2 levels in DLBCL GC naïve patient-derived xenograft (PDX) 75549 (after sorting CD45+ cells) and OCI-LY1 and OCI-LY19 DLBCL cell lines.
(B) Kaplan-Meier survival plots for OCI-LY1, OCI-LY19, and PDX 75549 xenografts treated daily with intraperitoneal (IP) olaparib or PBS (10 mice per cohort) after tumor reached a volume of 150 mm3. Mice were euthanized when tumor volume reached 1500 mm3 in OCI-LY1 and OCI-LY19 models or 1000 mm3 in PDX 75549 model. p value from Log-rank (Mantel-Cox) test are shown.
(C) Quantification of flow cytometry results for propidium iodide and annexin V staining of tumors excised from OCI-LY19 xenografts animals treated (IP) for 3 days with olaparib or PBS. p value from Student’s t test. Error bars represent SD obtained from 3 independent experiments.
(D) Western blots for LMO2 levels in DLBCL cell lines.
(E) Kaplan-Meier survival plots for OCI-LY8 xenografts. After tumors reached a volume of 150 mm3 mice were treated with intravenous PBS (control) or R-CHOP, and daily with olaparib (IP), or their combination (R-CHOP plus olaparib). Mice were euthanized when tumor volume reached 1500 mm3. The number of mice (n) per group is indicated. p values from Log-rank test are shown.
(F) Tumor volume versus time of individual mice treated as shown in (E).
(G) As in (E), for OCI-LY19 xenografts. The number of mice (n) per group is indicated. p value from Log-rank test is shown.
(H) Tumor volume versus time of individual OCI-LY19 mice treated as shown in (G).
See also Figure S4.

