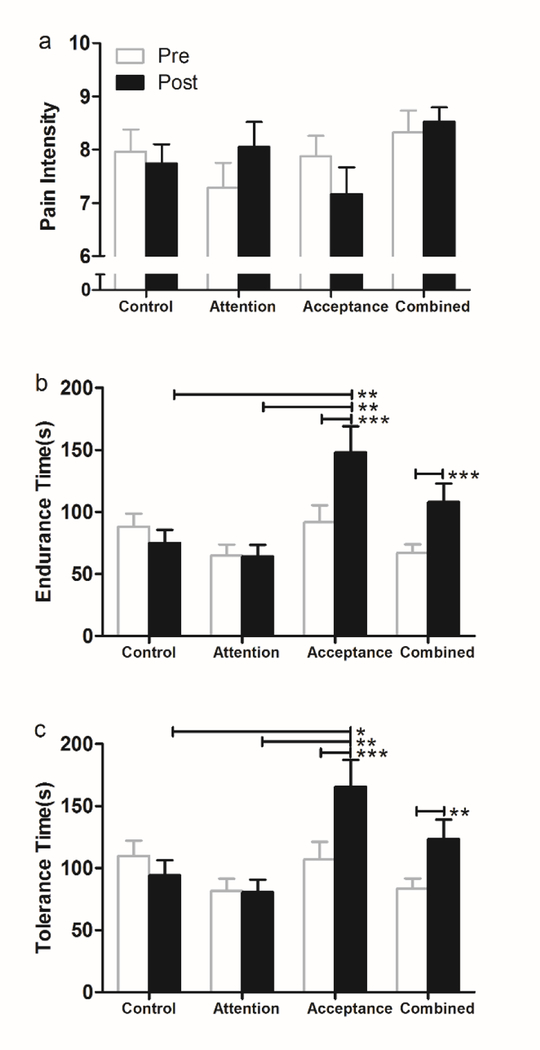
Figure 2.
Mean ± SEM scores for pain intensity, endurance time and tolerance time in each condition. (a) no significant changes in pain intensity ratings. (b) Within group analysis showed that both the acceptance group and the combined group significantly increased the pain endurance time (p < 0.001). Between group analysis revealed that in the post-test acceptance group significantly increased the endurance time than attention group (p = 0.001) as well as control group (p = 0.005). (c) Within group analysis showed that both the acceptance group and the combined group significantly increased the pain tolerance time (acceptance group: p < 0.001; combined group: p = 0.001). Between group analysis revealed that in the post-test acceptance group significantly increased the tolerance time than attention group (p = 0.002) as well as control group (p = 0.012). *p < 0.05, **p < 0.01, ***p < 0.001. SEM = standard error of the mean.

