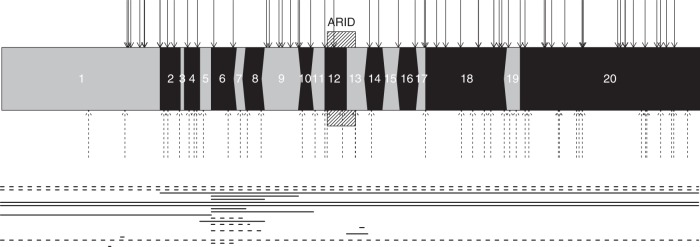
Fig. 1. Overview of the location of pathogenic variants in ARID1B.
Numbers represent exon numbers and a graphical representation of in-frame and out-frame exons. When an exon ends with a complete codon, a vertical line is displayed. If it has one additional base an arrow to the left is displayed, and two additional bases are indicated by an arrow to the right. In-frame exons thus have the same boundary on both sides of the exon. Small variants (defined as events ≤20 bases) are identified by the arrows above the exon structure; larger variants are shown as lines under the intron–exon structure. All large events were deletions. Only unique variants are shown. Uninterrupted lines represent variants in ARID1B-CSS patients; interrupted lines represent variants in ARID1B-ID patients.

