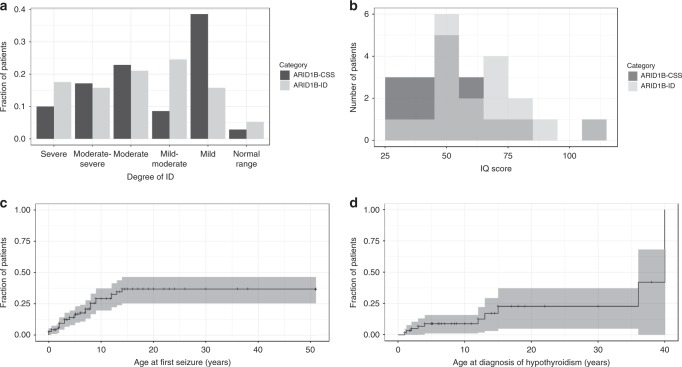
Fig. 3. Degree of intellectual disability and survival analyses of seizures and hypothyroidism.
(a) Intellectual disability (ID) category as assessed by the treating physician, n = 127; and (b) IQ scores (determined at different ages using different scales), n = 35 for ARID1B-CSS and ARID1B-ID patients. (c) Kaplan–Meier plot for age of onset of seizures, n = 37 and (d) Kaplan–Meier plot for the age at which hypothyroidism was diagnosed, n = 10. Confidence intervals of Kaplan–Meier plots are generated by R’s survfit function.

